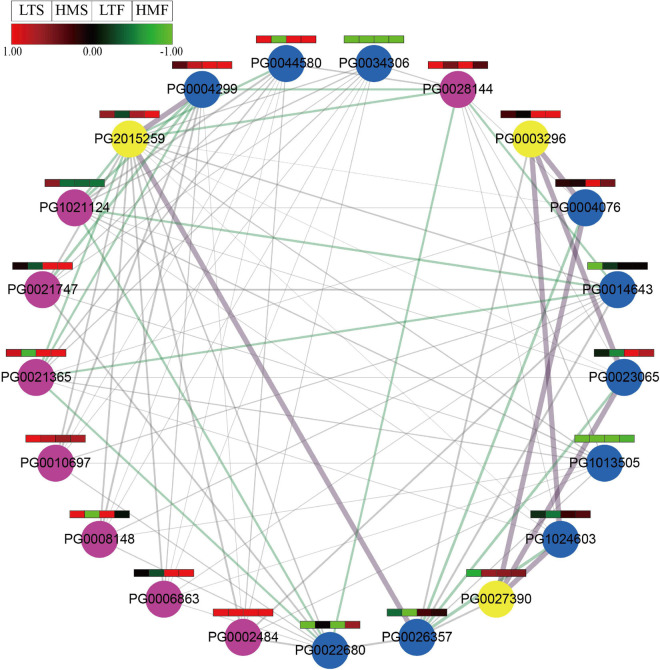
FIGURE 10.
Protein interaction network predicted for StNF-Y (combined score of 400, medium confidence). The purple lines represent the highest confidence (combined score > 900), the green lines indicate high confidence (combined score > 700), and the gray lines indicate medium confidence (combined score > 400). NF-YA subunits are highlighted in purple, NF-YB subunits are highlighted in blue, and NF-YC subunits are highlighted in yellow, respectively. The color scale was plotted using the log2FC of each gene.

