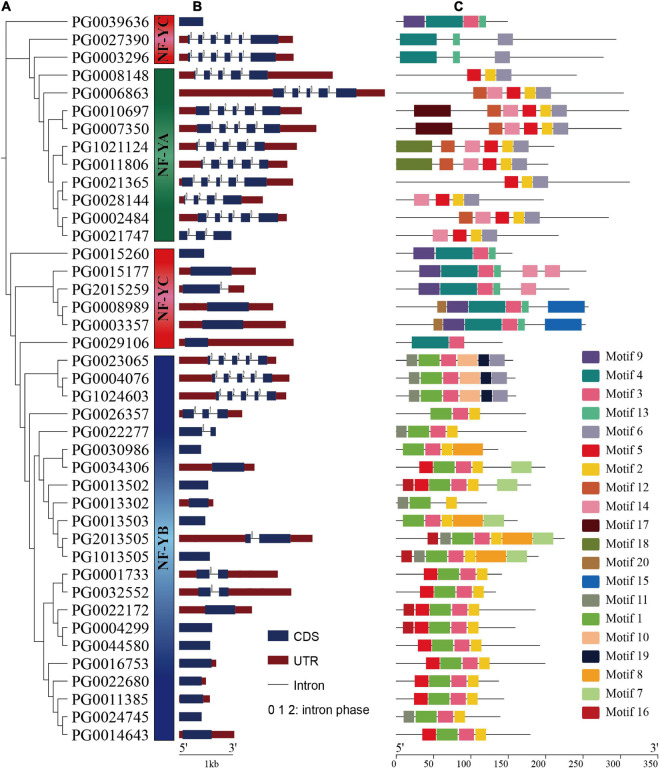
FIGURE 5.
Phylogenetic relationships, gene structure, and conserved motifs analysis of StNF-Ys. (A) Phylogenetic tree of StNF-Ys. (B) Exon/intron organization of the StNF-Y genes. The blue box indicates the exon, and the black line of the same length indicates the intron. The upstream/downstream area is indicated by a red box. The numbers 0, 1, and 2 represent the splicing phase of the intron. (C) Distribution of conserved motifs in StNF-Ys. The putative motifs were predicted by MEME program. The 20 boxes of different colors represent 20 different putative motifs. The details of the 20 putative motifs are in Supplementary Table 3.

