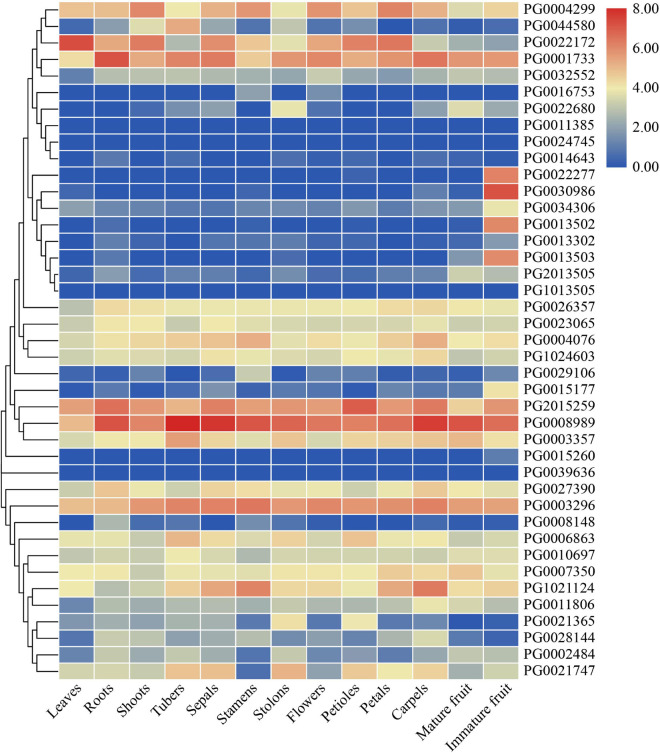
FIGURE 7.
An expression profile analysis of StNF-Y genes in different tissues (leaves, roots, shoots, tubers, sepals, stamens, stolons, mature flowers, petioles, petals, carpels, immature fruit, and mature fruit) in double haploid (DM) potato based on the transcriptome data. The color in the heat map represents the fragments per kilobase of exon per million fragments mapped (FPKM) value using logarithm with a base of 2.

