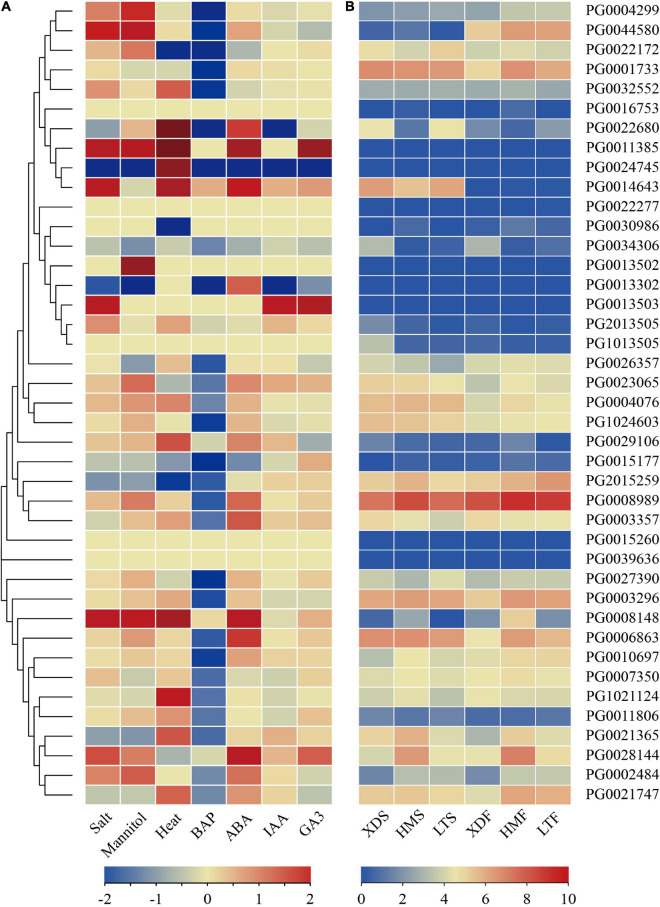
FIGURE 8.
The expression profiles of StNF-Y genes. (A) The expression profiles of StNF-Y genes under abiotic stresses (salt, mannitol, and heat stress) and hormone treatments (BAP, ABA, IAA, and GA3) in DM potato. The color scale was plotted using the log2FC of each gene. (B) The expression profiles of StNF-Y genes in white and pigmented potato tuber skin and flesh. XDS, LTS, HMS represent the white skin of white potato cultivar (Xindaping, XD), the red skin of red potato cultivar (Lingtianhongmei, LT), and the purple skin of purple potato cultivar (Heimeiren, HM), respectively. XDF, LTF, and HMF represent the white flesh of XD, the red flesh of LT, and the purple flesh of HM, respectively. The color in the heat map represents the FPKM value using logarithm with a base of 2. The heatmap was constructed by TBtools software. BAP, benzylaminopurine; ABA, abscisic acid; IAA, indole acetic acid; GA3, gibberellic acid.

