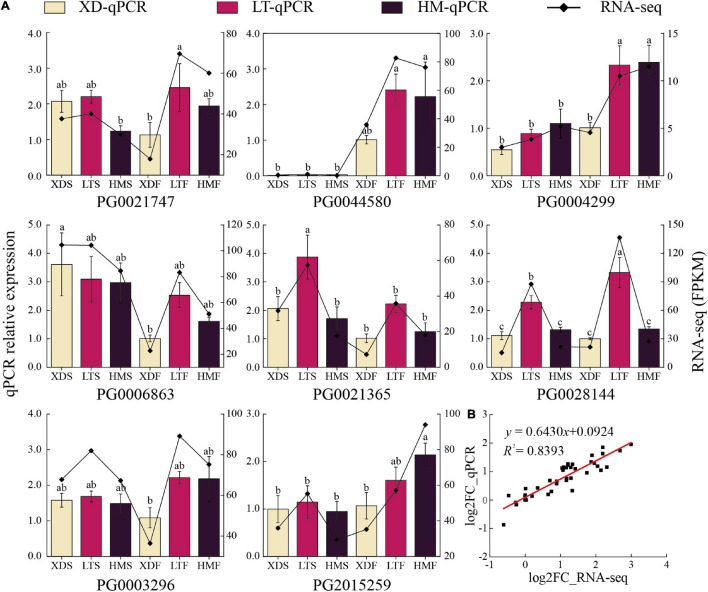
FIGURE 9.
The qPCR expression analyses of eight StNF-Y genes in (A) the skin/flesh (S/F) of white (XD), purple (HM), and red (LT) cultivars. (B) The correlation between qPCR and RNA-seq analysis. Error bars represent the means ± SE of three biological replicates. Different letters above bars denote significant difference at p < 0.05. Column graphs represent the relative expression levels of genes determined by qPCR; the values are shown on the left y-axis, and line graphs represent the FPKMs obtained by RNA-seq; the values are shown on the right y-axis.

