
Figure 1.
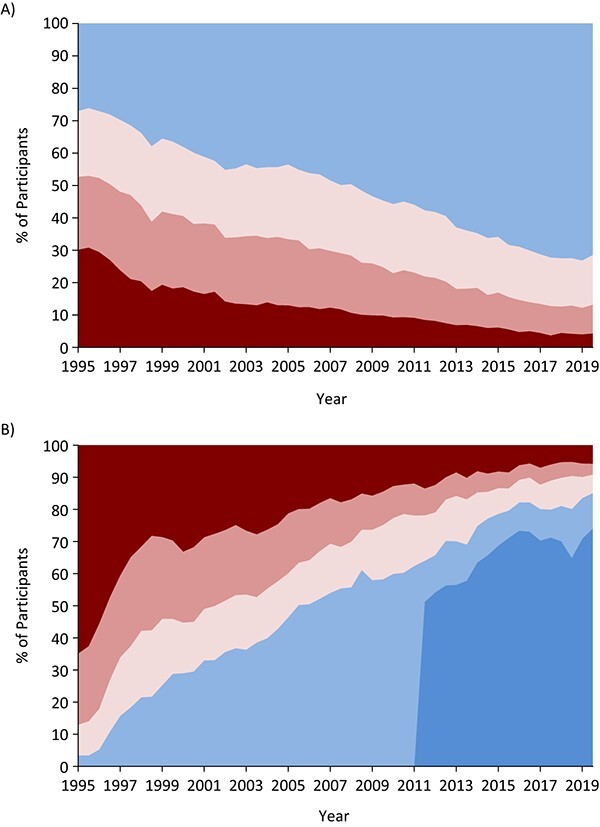
Distributions of cluster of differentiation 4 (CD4) cell counts (A) and plasma human immunodeficiency virus (HIV) viral RNA loads (B) among current Multicenter AIDS Cohort Study and Women’s Interagency HIV Study participants living with HIV, by year, 1995–2019. Data were restricted to current participants, and we used semiannual CD4 cell counts and HIV viral RNA load measures to explore these trends. CD4 cell count categories, from top to bottom (A): blue, ≥500 cells/mm3; lighter pink, 350–499 cells/mm3; darker pink, 200–349 cells/mm3; red, <200 cells/mm3. HIV RNA viral load categories, from top left to bottom right (B): red, >10,000 copies/mL; darker pink, 1,001–10,000 copies/mL; lighter pink, 81–1,000 copies/mL; lighter blue, ≤80 copies/mL; darker blue, ≤20 copies/mL. AIDS, acquired immunodeficiency syndrome.