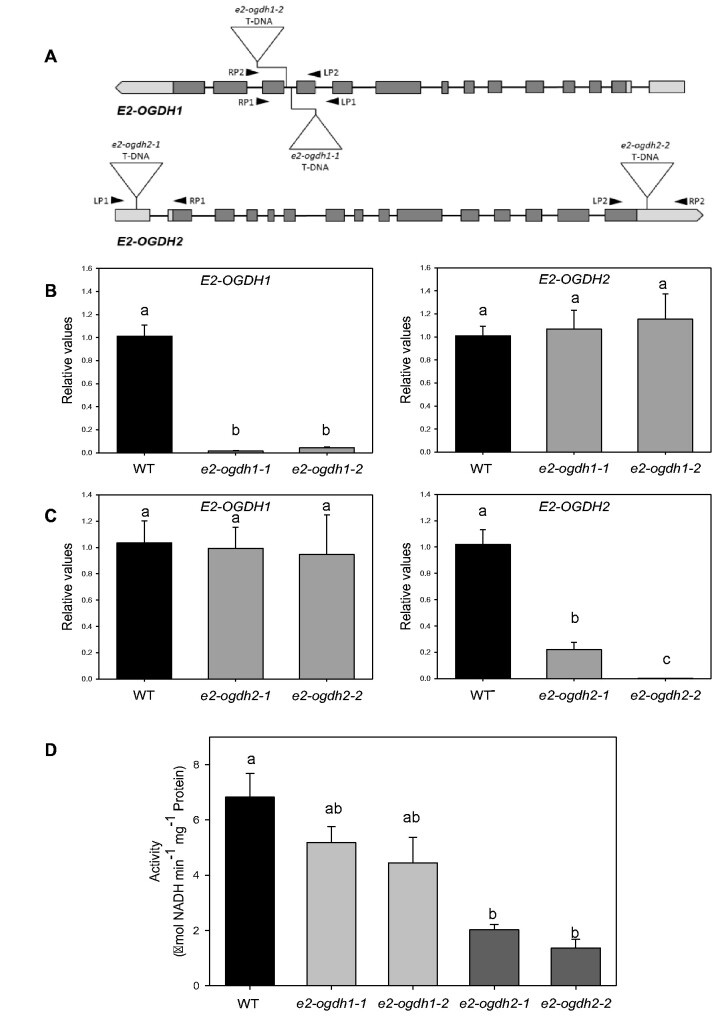
Fig. 1.
Expression and activity of 2-OGDH in Arabidopsis leaves of E2-OGDH mutant lines. (A) Schematic representation of the E2-OGDH1 and E2-OGDH2 gene structure. T-DNA insertion sites of the selected mutant lines are indicated. (B) Expression analysis of E2-OGDH1 and E2-OGDH2 in leaves of e2-ogdh1-1 and e2-ogdh1-2 mutant lines. (C) Expression analysis of E2-OGDH1 and E2-OGDH2 in leaves of e2-ogdh2-1 and e2-ogdh2-2 mutant lines. (D) 2-OGDH activity in fully expanded leaves of 5-week-old plants of e2-ogdh1 and e2-ogdh2 mutant lines. Values are presented as means ± SE of four individual plants. Different letters indicate a significant difference at P < 0.05 using one-way ANOVA followed by post hoc Tukey's test, alpha = 0.001.

