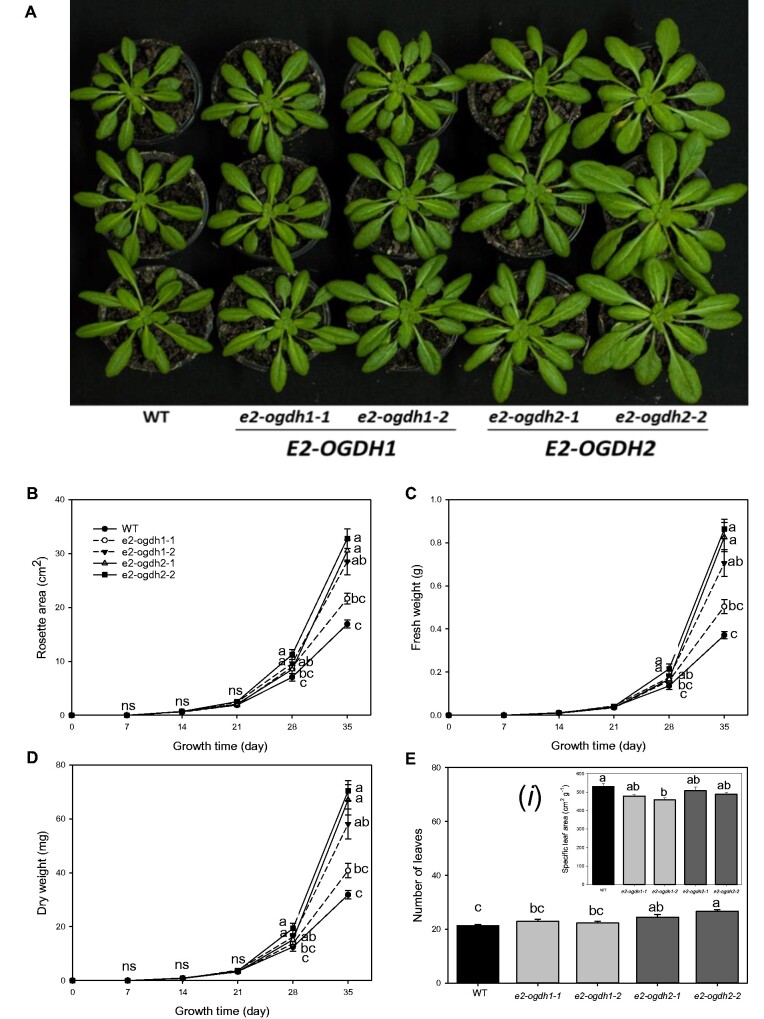
Fig. 2.
Growth phenotype of Arabidopsis E2-OGDH mutant plants. (A) E2-OGDH1 and E2-OGDH2 mutant plants after four weeks of cultivation. (B) Total leaf fresh weight, (C) total leaf dry weight, (D) rosette area, (E) number of leaves, and (Ei) specific leaf area. The lines used were as follows: the wild-type (WT, black bars); E2-OGDH1 mutant lines (light gray bars); and E2-OGDH2 mutant lines (dark gray bars). Values are presented as means ± SE of five individual plants per line. Different letters indicate a significant difference at P < 0.05 using one-way ANOVA followed by post hoc Tukey's test, alpha = 0.05.

