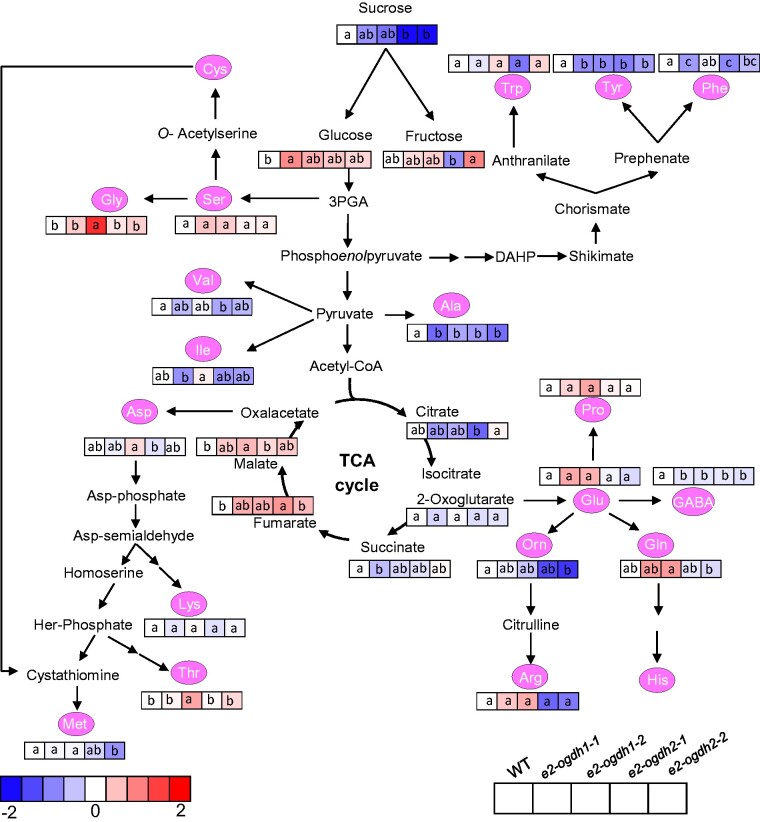
Fig. 7.
Relative metabolite content in fully expanded leaves of wild-type (WT) and E2-OGDH mutant lines at the middle of light period. The full data sets from these metabolic profiling studies are additionally available in Supplementary Table S3. Data are normalized with respect to the average response calculated for the corresponding WT (to allow statistical assessment, individual plants from this set were normalized in the same way). Different colors represent levels of metabolite fold change where red is increasing and blue is decreasing. Values are presented as means±SE of five individual plants per line. Different letters indicate a significant difference at P < 0.05 using one-way ANOVA followed by post hoc Tukey's test, alpha = 0.05.

