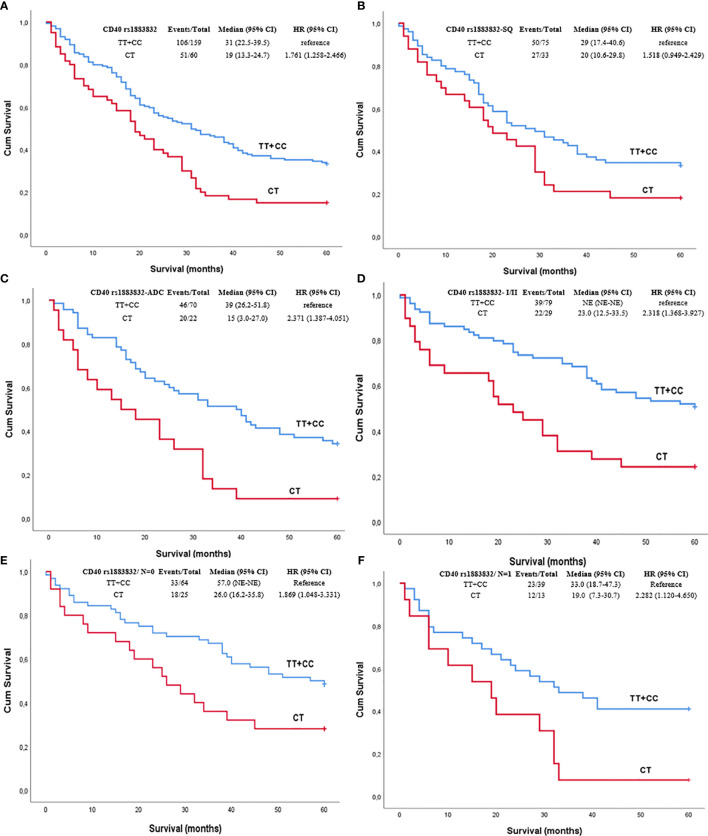
Figure 1.
Kaplan–Meier curves depicting overall survival (OS) of NSCLC patients in relation to (A) CD40 rs1883832 genotypes in the whole sub-cohort of NSCLC patients, (B) CD40 rs1883832 genotypes in SQ patients, (C) CD40 rs1883832 genotypes in ADC patients, (D) CD40 rs1883832 genotypes in stage I and II patients, (E) CD40 rs1883832 genotypes in NSCLC patients with N = 0, (F) CD40 rs1883832 genotypes in NSCLC patients with N = 1. SQ, squamous cell carcinoma; ADC, adenocarcinoma.

