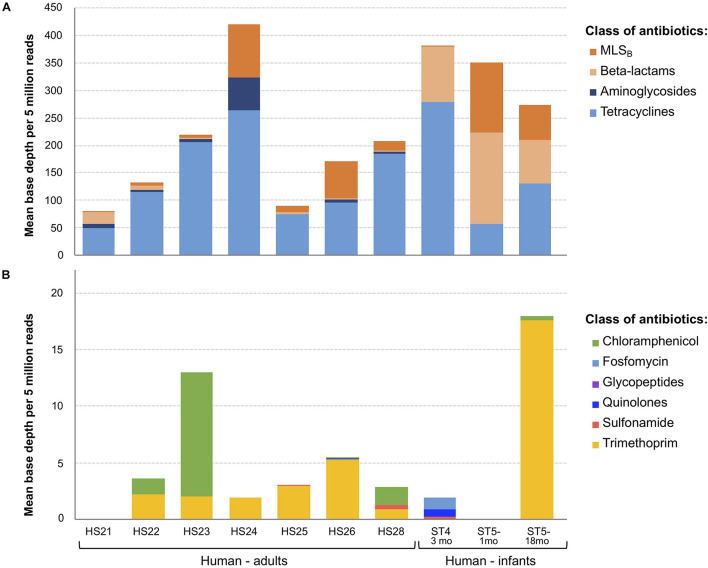
FIGURE 2.
Overview of antimicrobial resistance genes (ARGs) abundance and composition in fecal samples (n = 10) using the shotgun metagenomics sequencing (SMS) method. (A) Major vs. (B) minor ARGs. ARGs abundance was calculated as a “mean base depth per 5 million reads” (BD5M) for each gene in each sample, and then summed for ARGs belonging to the same class of antibiotics.

