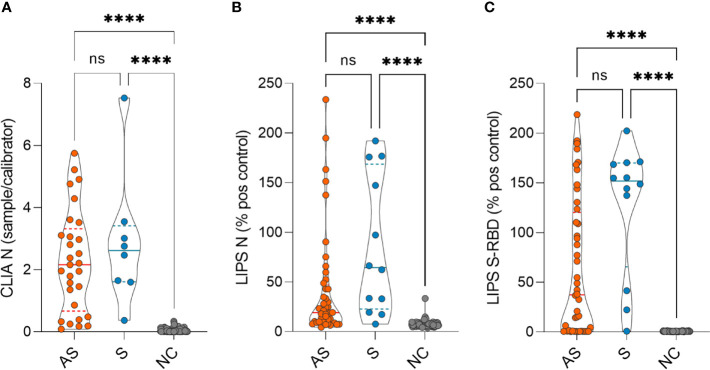
Figure 1.
SARS-CoV-2 antibody levels in asymptomatic (AS), symptomatic (S), and negative control (NC) individuals as measured by (A) CLIA (n= 29 AS, 8 S and 115 NC) and (B) LIPS to N protein (n= 44 AS, 12 S and 115 NC) and (C) LIPS to S-RBD (n= 44 AS, 12 S and 115 NC) 7-8 months after the infection. CLIA is given as a fold difference of sample vs calibrator and LIPS results as the % of the positive control. Statistical differences were calculated with Kruskal-Wallis test with Dunn's multiple comparison testing. The statistical significance on violin plots is marked as **** = adj. P ≤ 0.0001; ns, non-significant.

