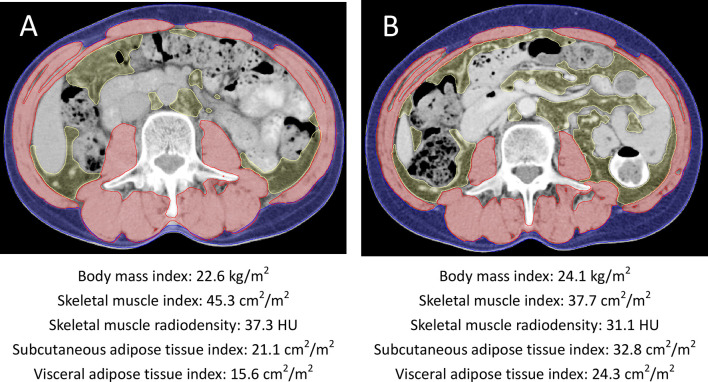
Figure 1.
Axial cross-sectional CT images at the L3 vertebral level (A) at baseline and (B) at 6 months after initiation of radiotherapy and androgen deprivation therapy from one patient. The skeletal muscle areas, subcutaneous adipose tissue areas, and visceral adipose tissue areas were outlined in red, blue, and yellow, respectively. This patient had increased body mass index, subcutaneous and visceral adipose tissue indexes and decreased skeletal muscle index during radiotherapy and androgen deprivation therapy.

