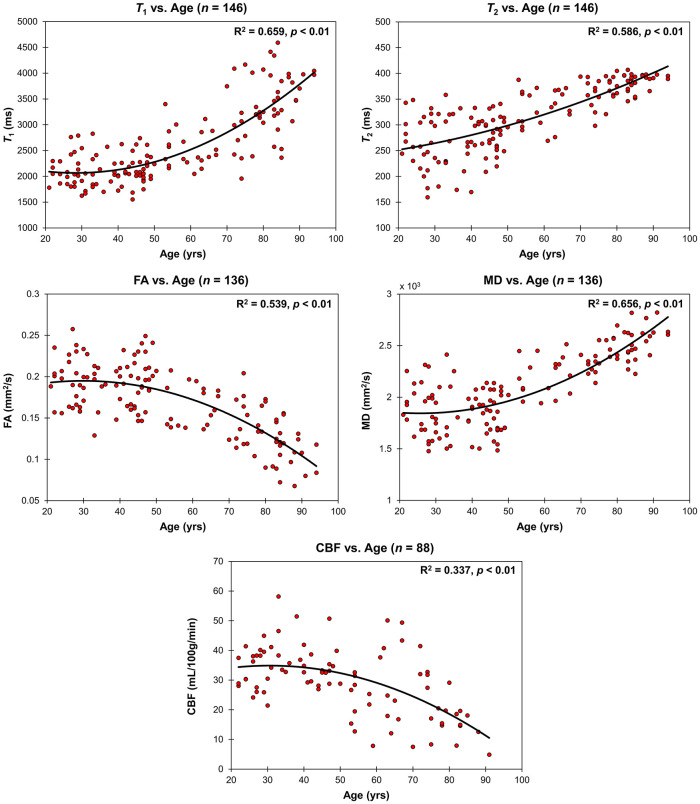
FIGURE 3.
Regressions of relaxometry measures (T1 and T2), DTI measures (FA and MD), or CBF with age. For each plot, the coefficient of determination, R2, and p-value, p, are reported. T1, T2 and MD exhibit non-linearly increasing trends with age while FA and CBF exhibit a non-linearly decreasing trends with age.

