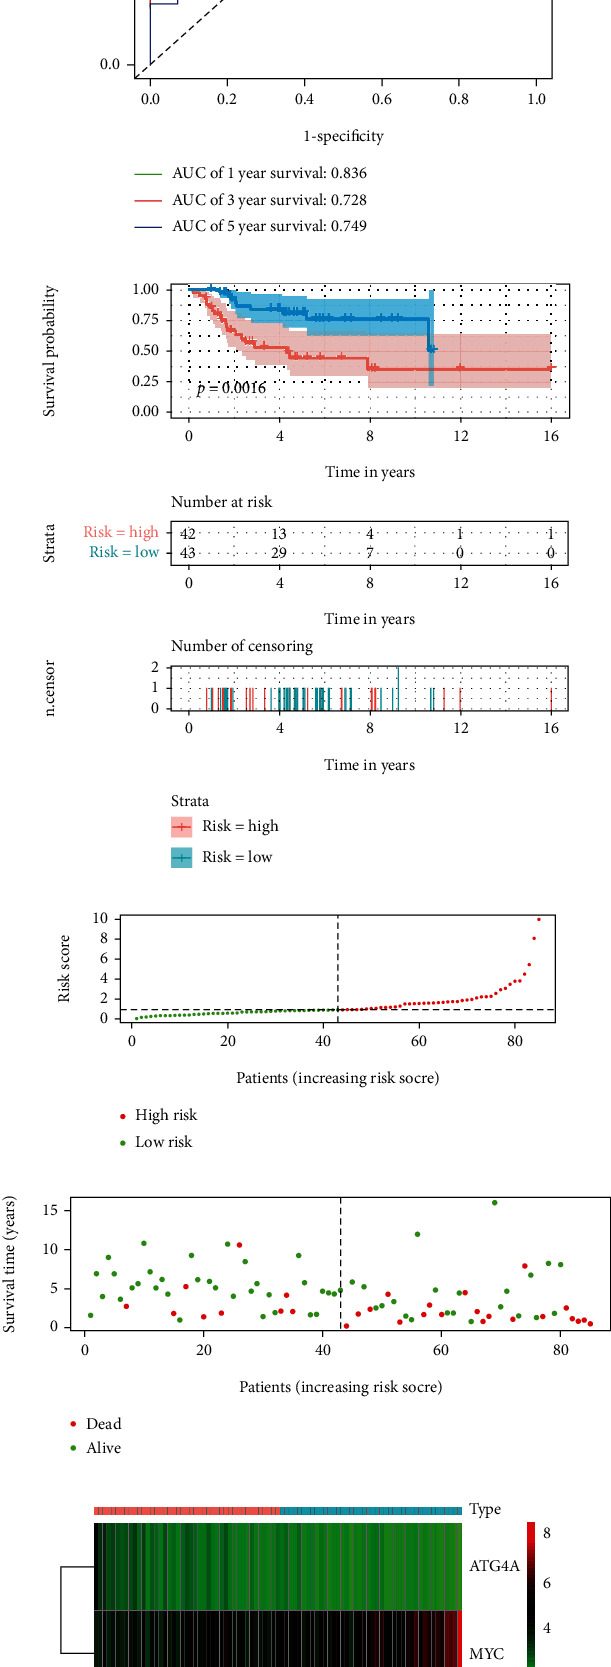
Figure 2.

The construction of risk signature. A and B, ROC curve analysis and survival analysis of training cohort. ROC curve shows that the risk signature of training cohort can be used to predict the prognosis of patients with osteosarcoma. Kaplan-Meier survival curve shows that the risk signature of high-risk group and low-risk group of training cohort have predictive value for prognosis. C-E, Training cohort riskScore distribution, patient survival status distribution, and relationship between riskScore and expression of two OS-related ARGs. ROC: receiver operating characteristic; OS-related ARGs: autophagy-related genes related to overall survival.
