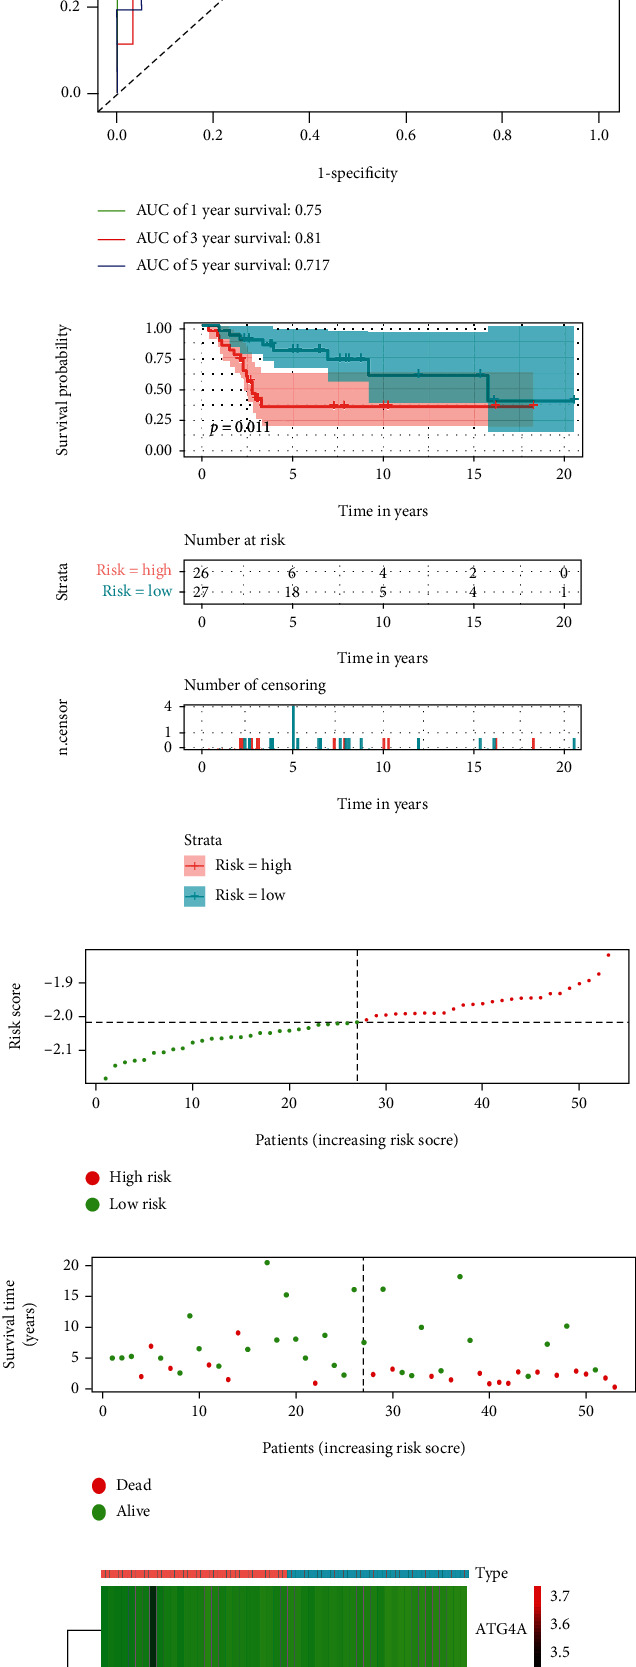
Figure 3.

Verification of risk signature. (a), validation cohort ROC curve analysis, ROC curve showed that risk signature could be used to predict the prognosis of osteosarcoma patients; (b), validation cohort survival analysis, Kaplan-Meier survival curve shows that validation cohort high-risk group and low-risk group risk signature have predictive value for prognosis. C-E, Validation cohort riskScore distribution, patient survival status distribution, and relationship between riskScore and expression of two OS-related ARGs. ROC: receiver operating characteristic; OS-related ARGs: autophagy-related genes related to overall survival.
