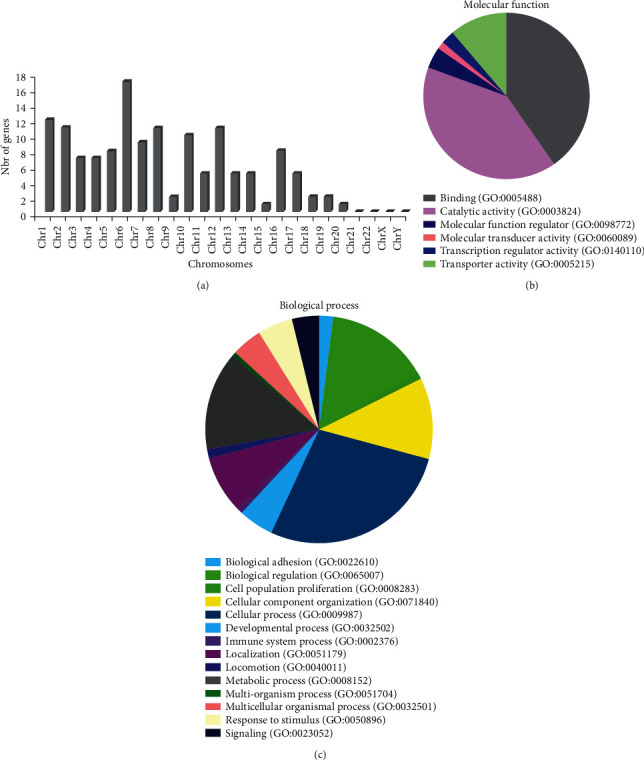
Figure 2.

Analysis of the differentially methylated genes. (a) Distribution of differentially methylated genes between score 0 and score 6 sperm samples in the human chromosomes. (b) Gene Ontology (GO) classification of the differentially methylated genes in molecular function categories. (c) GO classification of the differentially methylated genes in biological process categories. The two pie charts were generated with the PANTHER tool.
