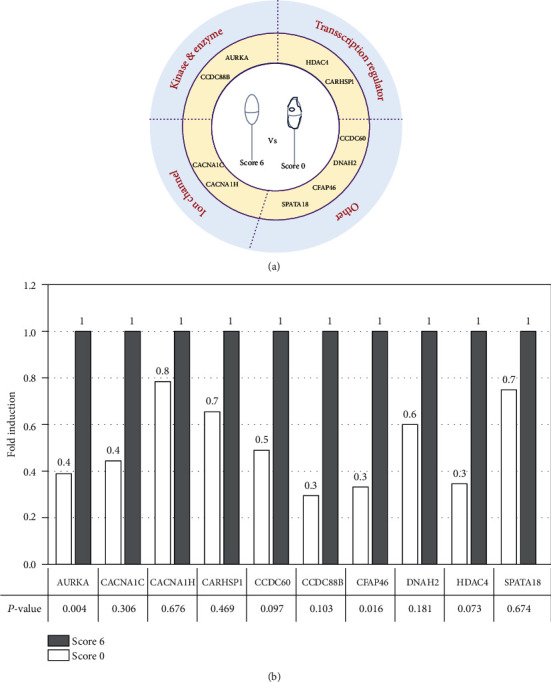
Figure 4.

Relative expression level of 10 genes that are differentially expressed in score 0 and score 6 spermatozoa. (a) Graphical representation of the gene types. (b) Gene expression was compared between score 0 (white) and score 6 (black; reference, set to 1) sperm samples by RT-qPCR analysis. p value were calculated with the Mann–Whitney test.
