
Figure 5.
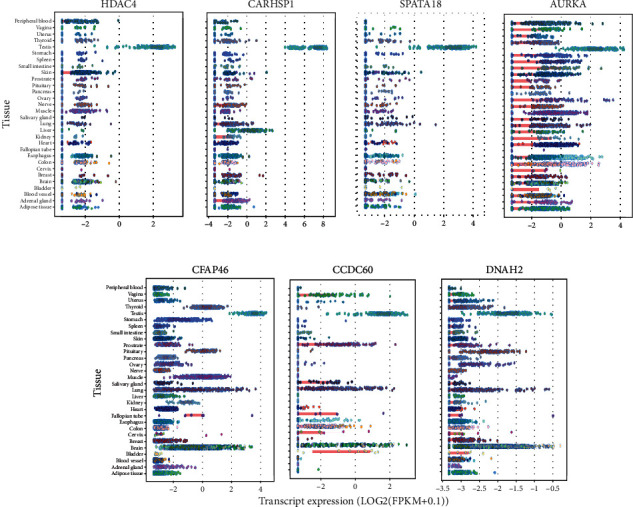
Expression profile of candidate genes in different human tissues. Expression values (in Log2 (RPKM)) of HDAC4, CARHSP1, SPATA18, AURKA, CCDC60, DNAH2, and CFAP46 in 30 tissues from the Genotype-Tissue Expression (GTEx) consortium. For each gene, the colored circle belonging to each tissue indicates the valid RPKM value of all samples in the tissue. RPKM: reads per kilobase of transcript per million mapped reads.