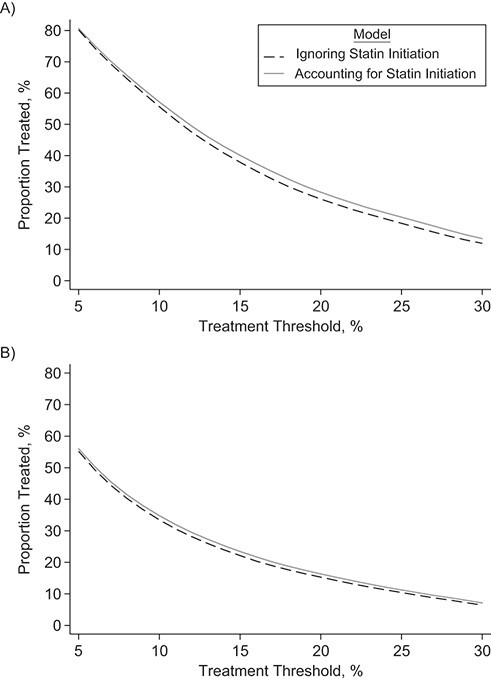
Figure 6.

Proportion of individuals with 10-year predicted risk exceeding a range of treatment thresholds from 5% to 30% using the statin-naive versus the standard cardiovascular disease risk, for men (A) and women (B) in the validation data set, Clinical Practice Research Datalink, Hospital Episode Statistics, and the Office for National Statistics, England, United Kingdom, 2004–2017. Weighted proportions across all ages were calculated using the most recent available data for an age- and sex-standard England population aged 40–85 years.
