
Figure 2 .
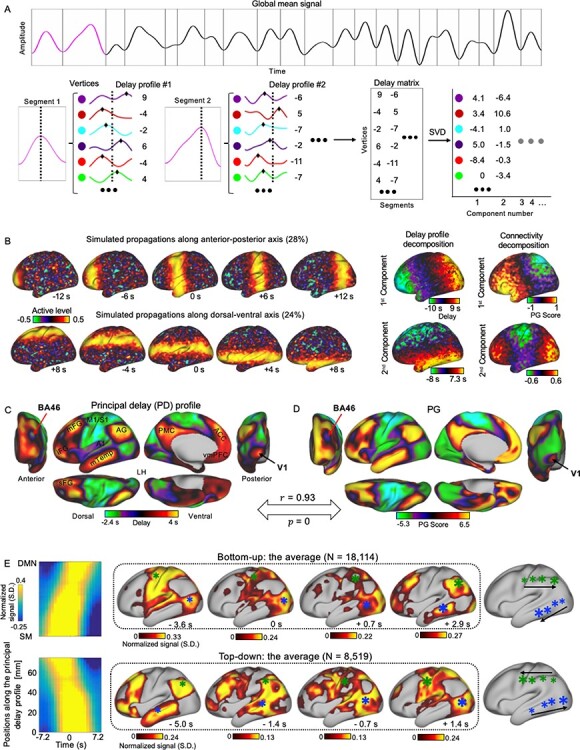
The major propagating direction of rsfMRI signals is highly similar to the PG of rsfMRI connectivity. (A) Illustration of the procedures for deriving the PD profiles that represent the major propagating directions of rsfMRI signals. Specifically, the fMRI signals were cut into time segments based on the troughs of the global mean signal denoted by the gray vertical lines. Next, a delay profile was computed for each segment as the relative time delays of the local peak (black diamonds) at each cortical vertex with respect to the global peak (black dashed line). Finally, an SVD was applied to the delay matrix composed by delay profiles to extract the PD profile. (B) Decomposing delay profiles of synthesized fMRI data (left) using the proposed method recovered the directions of simulated propagating structures (middle). The decomposition of the connectivity matrix of the synthesized signals using the PG method recovered the dominant direction but not the second one (right). (C) The application of the proposed method to real rsfMRI data produced the PD profile representing the principal direction of infra-slow rsfMRI propagations, which is extremely similar (r = 0.93, P = 0) to (D) the PG of rsfMRI connectivity, including detailed features at the V1 and Brodmann area 46 (BA 46). (E) The averaged bottom-up (top, N = 18 114) and top-down (bottom, N = 8519) propagations as presented on the time–position graphs (left) and the brain surface (right). The averaged propagating patterns on both the lateral and medial surface in 2 hemispheres were shown in Supplementary Fig. S29B. Abbreviations: A1, primary auditory cortex; sFG, superior frontal gyrus; PMC, posteromedial cortex; ACC, anterior cingulate cortex; vmPFC, ventromedial prefrontal cotex.