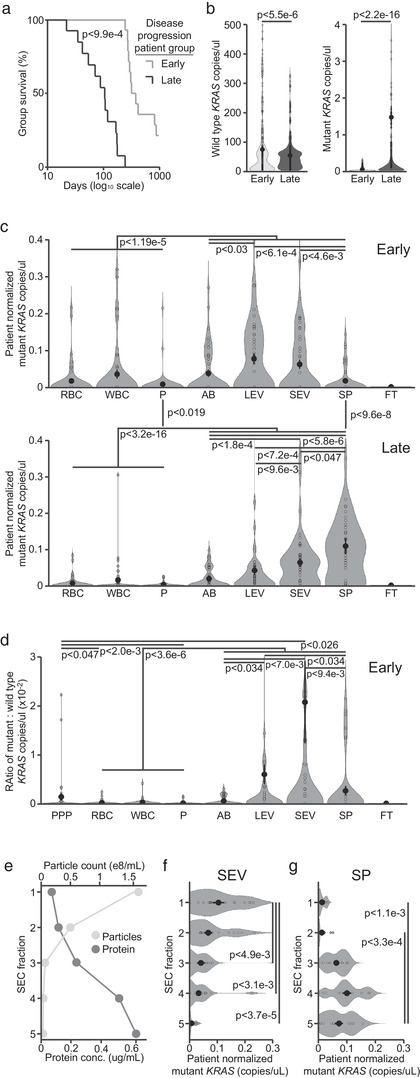
FIGURE 2.

Blood components are associated with distinct amounts of wild type and mutant KRAS DNA in PDAC patients. (a) Kaplan‐Meier curves showing the days of survival following blood sampling for 14 early and 13 late group samples. (b) Copies/μl dPCR reaction mix of wild type (left) and mutant (right) KRAS DNA found in all blood components of early and late group patients. (c) Patient normalized copies/μl of mutant KRAS DNA found in each blood component in early (top) and late (bottom) group patients. (d) Ratio of mutant : wild type KRAS DNA copies/μl for each blood component and platelet poor plasma (PPP) in early patients. (e) Particle count and protein concentration for the five SEC fractions derived from two pooled SEV fractions. (f) Copies/μl of mutant KRAS DNA found in each SEC fraction of patient SEVs. (g) Copies/μl of mutant KRAS DNA found in each SEC fraction of patient SP. Statistics for a&b are derived from two‐tailed unequal variance t‐tests between indicated groups. Statistics for c–g are derived from two‐tailed unpaired Mann‐Whitney‐Wilcoxon tests between indicated groups
