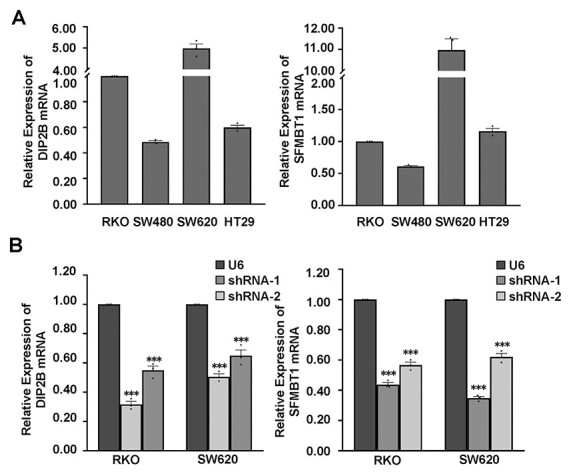
Figure 2 .

Knockdown of endogenous DIP2B and SFMBT1 in RKO and SW620 cell lines. (A) Quantitative RT-PCR analysis for DIP2B and SFMBT1 mRNA levels in various colorectal cancer cell lines; Beta-actin was used as a loading control. (B) The relative mRNA expression for target genes in RKO and SW620 cell lines transfected with U6 (control) and shRNA lentiviruses; Beta-actin was used as a loading control. The data are the mean ± SEM; *P < 0.05, **P < 0.01, ***P < 0.001.
