
Figure 4.
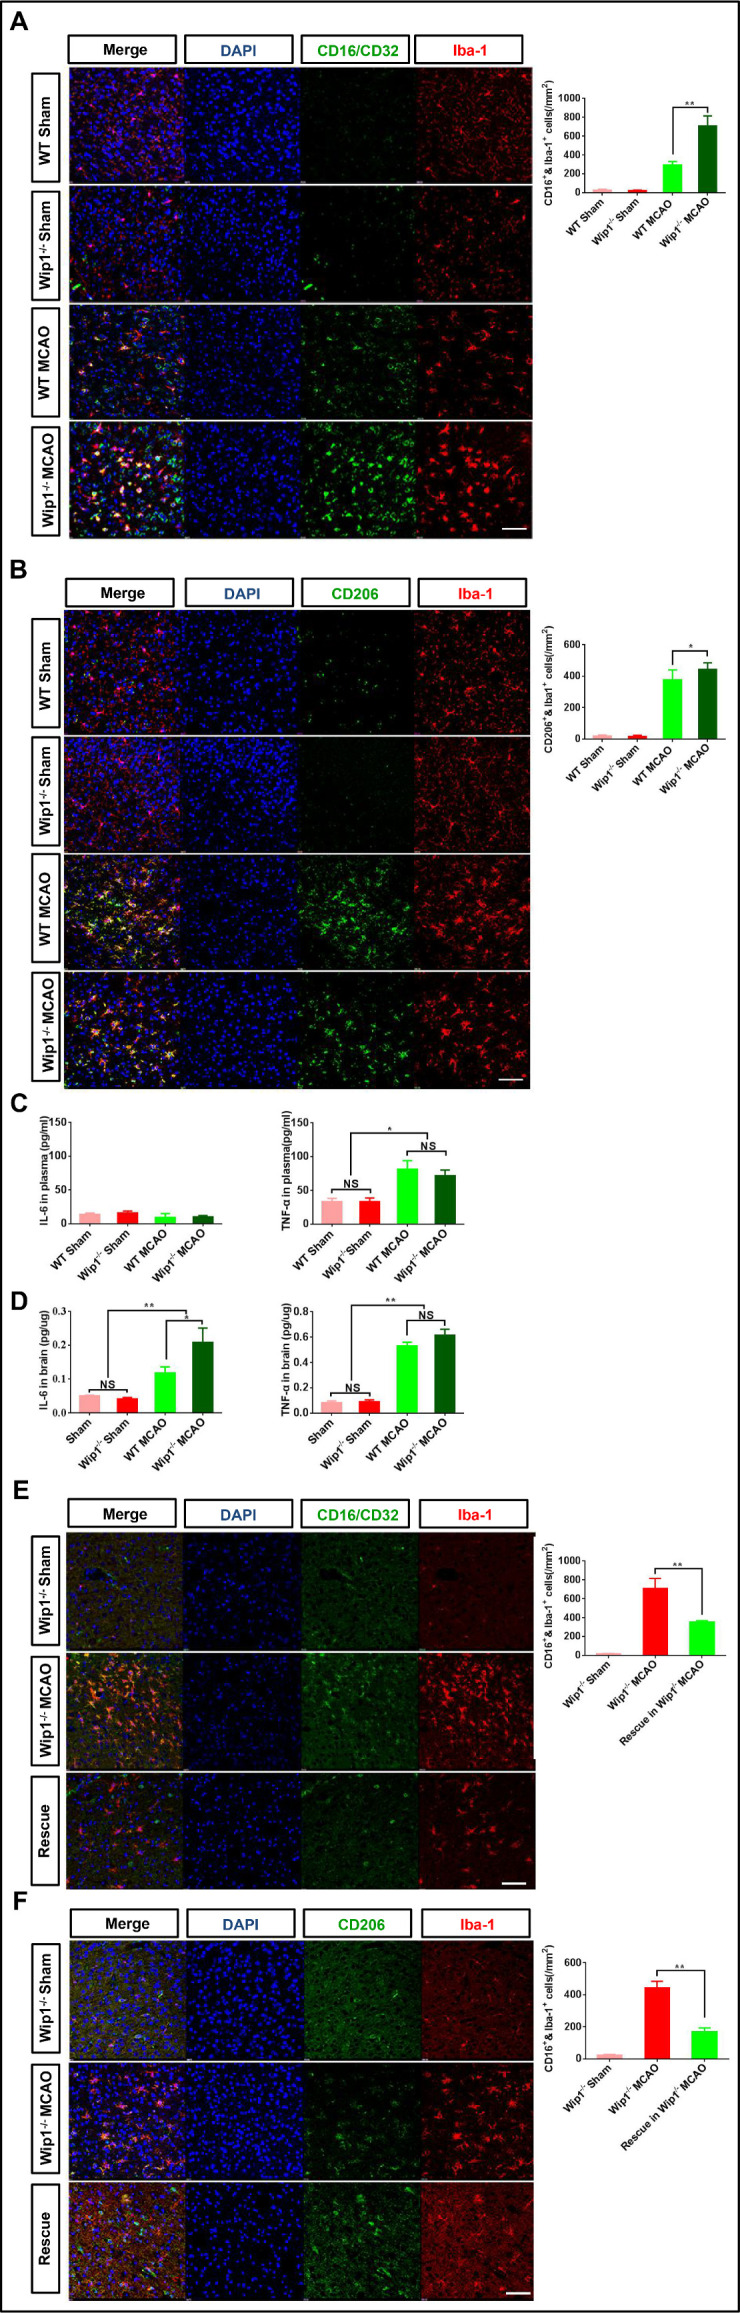
Loss of Wip1 promoted activation of microglia/macrophages and increased inflammation in the brain after ischaemia/reperfusion, and injection of lentivirus-Ppm1d inhibited microglial activation and inflammation. (A) Left: representative dual if staining of CD16-positive and Iba-1-positive cells in the cortex 3 days after brain ischaemia/reperfusion. Scale bar: 50 µm. Right: quantification of CD16-positive and Iba-1-positive cells in the cortex 3 days after ischaemia/reperfusion. n=6 mice per group. Data are expressed as mean±SEM, **p<0.01 (WT MCAO group vs Wip1-KO MCAO group). (B) Left: representative dual if staining of CD206-positive and Iba-1-positive cells in the cortex 3 days after brain ischaemia/reperfusion. Scale bar: 50 µm. Right: quantification of CD206-positive and Iba-1-positive cells in the cortex 3 days after ischaemia/reperfusion. n=6 mice per group. Data are expressed as mean±SEM, **p<0.01 (WT MCAO group vs Wip1-KO MCAO group). (C) Quantification of IL-6 and TNF-α in peripheral blood. n=8 mice/group. Data are expressed as mean±SEM, *p<0.05 (MCAO group vs sham group). (D) Quantification of IL-6 and TNF-α in the ischaemic cortex. n=8 mice/group. Data are expressed as mean±SEM, **p<0.01 (MCAO group vs sham group). (E) Left: representative dual if staining of CD16-positive and Iba-1-positive cells in the cortex 3 days after lateral cerebroventricular injection and brain ischaemia/reperfusion. Scale bar: 50 µm. Right: quantification of CD16-positive and Iba-1-positive cells in the cortex on the third day after lateral cerebroventricular injection and brain ischaemia/reperfusion. n=6 mice/group. Data are expressed as mean±SEM, **p<0.01 (WT MCAO group vs Wip1-KO MCAO group). (F) Left: representative dual if staining of CD206-positive and Iba-1-positive cells in the cortex on the third day after lateral cerebroventricular injection and brain ischaemia/reperfusion. Scale bar: 50 µm. Right: quantification of CD206-positive and Iba-1-positive cells in the cortex on the third day after lateral cerebroventricular injection and brain ischaemia/reperfusion. n=6 mice/group. Data are expressed as mean±SEM, ***p<0.001 (WT MCAO group vs Wip1-KO MCAO group). Avg, average; Iba-1, ionised calcium-binding adaptor molecule 1; IL, interleukin; KO, knockout; MCAO, middle cerebral artery occlusion; NS, not significant; TNF-α, tumour necrosis factor alpha; Wip1, wild-type p53-induced protein phosphatase 1; WT, wild type.