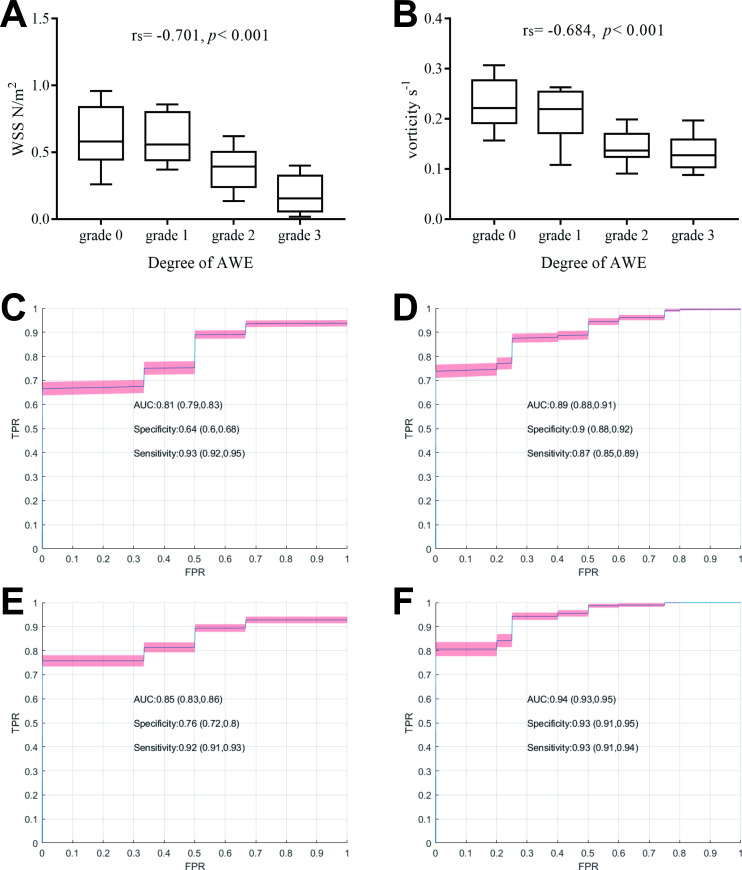
Figure 4.
Box diagram illustrating the relationship between WSS/vorticity and degree of AWE, as well as the prediction performance of AWE and CAWE. (A) Correlation coefficients were calculated using Spearman’s correlation analysis and showed that WSS is negatively correlated with AWE. (B) Correlation coefficients were calculated by Spearman’s correlation analysis and showed that the average vorticity in the IA is negatively correlated with AWE. The ROC curves of logistic regression models are (C) WSSavg-IA predict AWE, (D) WSSavg-IA predict CAWE, (E) WSSavg-IA and Vorticityavg-IA predict AWE and (F) WSSavg-IA and Vorticityavg-IA predict CAWE, respectively. AUC, sensitivity and specificity are reported with 95% CI. AUC, area under curve; AWE, aneurysmal wall enhancement; CAWE, circumferential AWE; FPR, false positive rate; IA, intracranial aneurysm; ROC,; TPR, true positive rate; WSS, wallshear stress.

