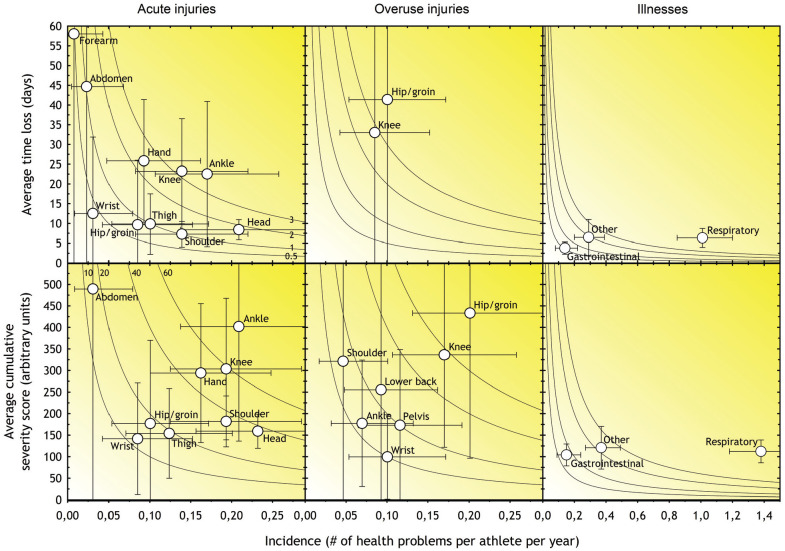
Figure 1.
Risk matrices illustrating the relationship between severity (consequence) and incidence (likelihood) of the most commonly reported types of injuries in Norwegian junior elite ice hockey. For each injury in all matrices, incidence is shown as cases per athlete per year. The shading illustrates the relative importance of each of the injury types; the darker the color, the greater the injury burden and the greater the priority that should be given to prevention. The gray isobars show burdens of 0.5, 1, 2, and 3 days lost per year per athlete. The vertical and horizontal error bars represent 95% CIs. Regions with an average burden of <0.35 days for time loss and a cumulative severity score of <8 are not included in the figure.

