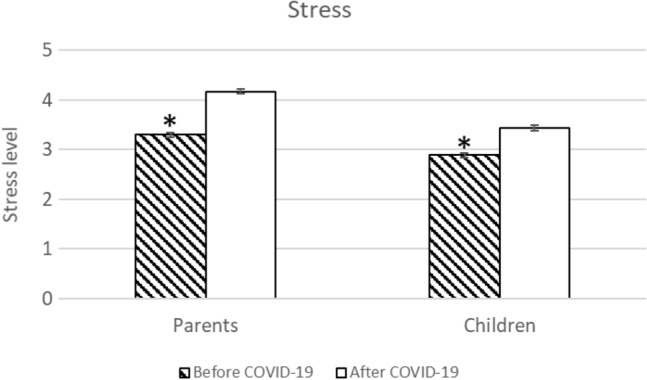
Fig. 2.

Average stress level of parents and their child before and after the onset of the pandemic (N = 288). Errors bars represent standard error, and asterisks denote a significant difference between the two time points (p < .05)

Average stress level of parents and their child before and after the onset of the pandemic (N = 288). Errors bars represent standard error, and asterisks denote a significant difference between the two time points (p < .05)