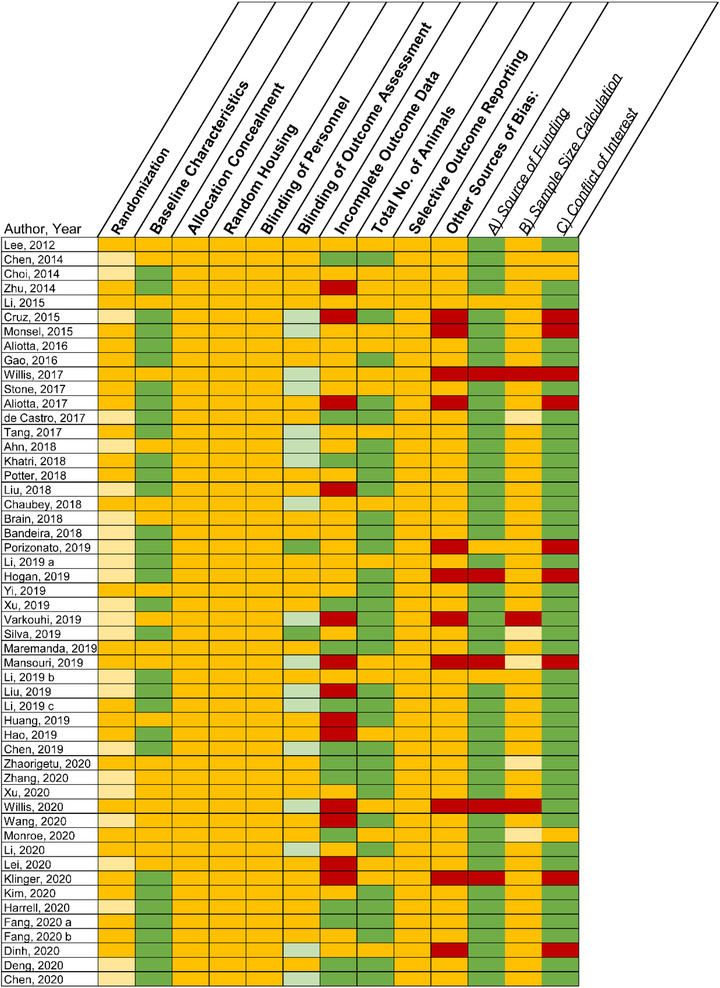
FIGURE 10.

Risk of bias assessment in accordance with the SYRCLE tool. Yellow represents unclear, green represents low risk of bias and red represents high risk of bias. Light yellow represents a study that reported randomization or sample size calculations, but did not provide detailed methodology on how these parameters were achieved. Light green under ‘blinding of outcome’ represents studies that blinded some outcomes, whereas dark green represents blinding of all outcomes
