
Figure 2.
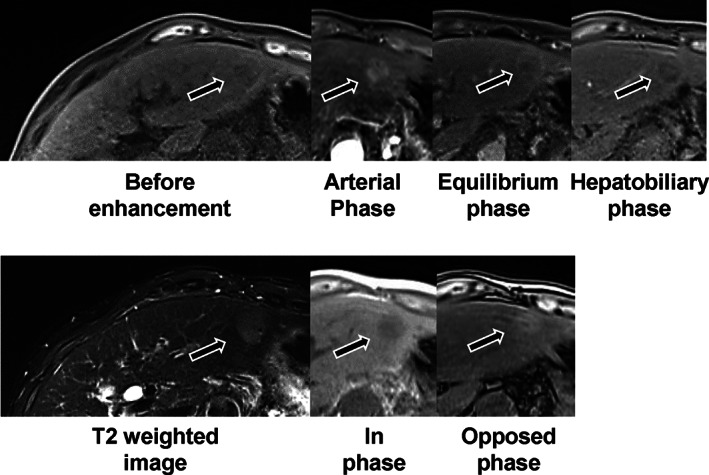
Magnetic resonance imaging (MRI) of the liver. The liver exhibited mildly dull‐edged surface and high‐intensity signal in T1 in‐phase and low in opposed phase in MRI. The tumor revealed low intensity in T1 in‐phase and high in opposed phase, high‐intensity signal in T2‐weighted image, and early enhancement effect in the arterial phase and low intensity in the hepatobiliary phase of Gadolinium‐ethoxybenzyl‐diethylenetriamine pentaacetic acid (Gd‐EOB‐DTPA) MRI (black arrows).