Fig. 2.
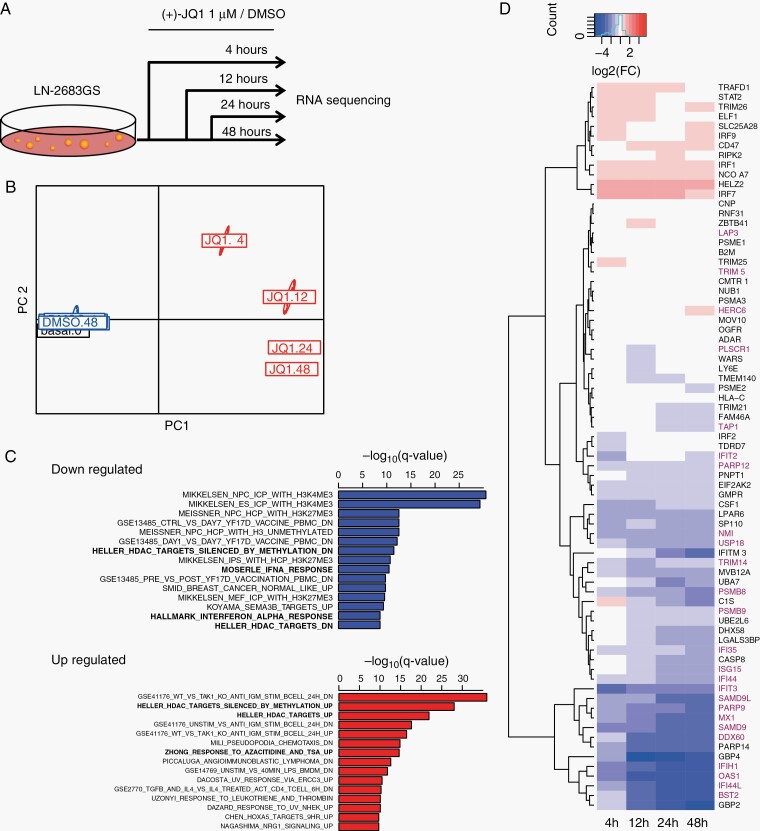
Transcriptome analysis of JQ1 effects. (A) Experimental setup of differential gene expression analysis by RNA-seq. LN-2683GS cells were treated with 1 µM (+)-JQ1 or DMSO for 4, 12, 24, and 48 hours, the experiment was repeated 3 times, followed by RNA-seq. (B) Principal coordinate analysis of the raw read counts of RNA-seq data. PC1, PC2: principal coordinates 1 and 2. (C) Top 15 downregulated (blue) and upregulated (red) gene sets based on GSEA (q-value, Bonferroni corrected for multiple testing). Gene sets in bold were selected for further analysis. (D) Heatmap of log2FC (FC: fold change) of expression of IFN-α response gene set (HIAR). Genes marked in red overlap with our GBM IFN-signature (G12, Supplementary Figure S3).35 Abbreviations: DMSO, dimethyl sulfoxide; GBM, glioblastoma; GSEA, gene-set enrichment analysis; HIAR, hallmark interferon alpha response; IFN-α, interferon alpha.

