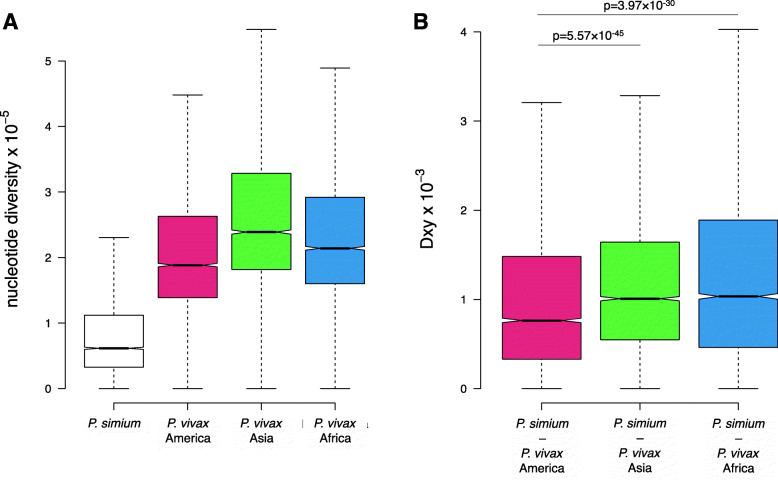
Fig. 2.
Nucleotide diversity and genetic distance between populations. A Diversity within populations. Box plot showing the nucleotide diversity in 10-kb windows between Plasmodium simium samples (left), and Plasmodium vivax samples from America, Asia and Africa. B Genetic distance between populations. Box plot showing DXY in 10-kb windows comparing Plasmodium simium samples to P. vivax samples from America, Asia and Africa. P values from one-sided Mann-Whitney tests for difference in medians are shown above boxes. For both plots, boxes denote 25th and 75th percentiles with all outliers removed

