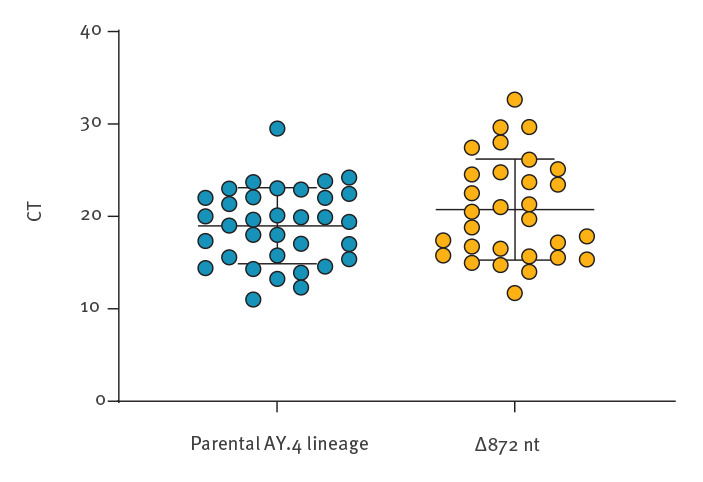
Figure 3.
Comparison of viral load between the SARS-CoV-2 Delta AY.4 lineage (n = 34) and the Delta AY.4 isolates with the 872 nt deletion (n = 30), Poland, 17 July–11 August 2021
CT: cycle threshold; SARS-CoV-2: severe acute respiratory syndrome coronavirus 2.
Each point refers to single sample, for which the CT value was calculated as a mean CT obtained from three target genes (E, N, ORF1a) obtained during routine diagnostic RT-qPCR. CT values are compared between SARS-CoV-2 AY.4 samples (n = 34) and Delta AY.4 isolates with the 872 nt deletion (n = 30). Error bars indicate standard deviation of the mean. The difference is statistically insignificant (p > 0.05, unpaired t-test).

