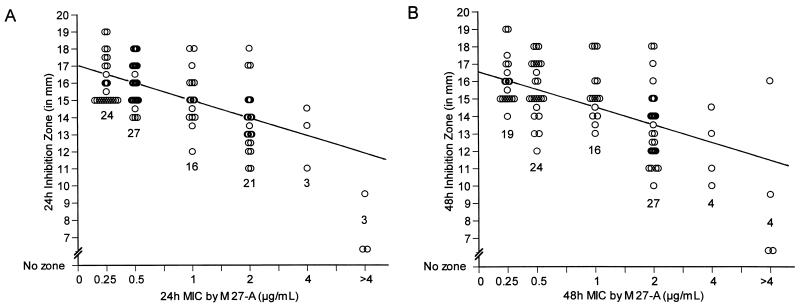
FIG. 1.
Correlation of broth method-determined MICs with agar inhibition zones. MK-0991 susceptibility values for 94 isolates obtained by the broth microdilution M27-A methodology versus the corresponding inhibition zones on agar are shown at 24 h (A) and 48 h (B). The line of best fit is shown, and the regression statistics are as follows: y = 14.77 − 2.96 log10 [MIC] (r = 0.59) at 24 h and y = 14.59 − 2.83 log10 [MIC] (r = 0.53) at 48 h. Shown also is the number of isolates at each MIC.

