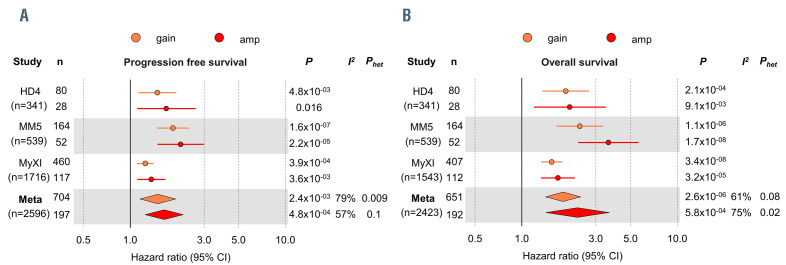
Figure 1.
Prognostic impact of gain and amplification of 1q21 in multiple myeloma. Forest plot of a meta-analysis for (A) progression-free survival and (B) overall survival for gain(1q) (orange) and amp(1q) (red), validating the prognostic impact of both lesions in the independent GMMG HD4 and MM5 and the NCRI Myeloma XI trials. Column “n” shows the number of patients with gain(1q) or amp(1q) per trial. The total number of patients included per trial is shown in brackets in the column “study”. Circles show hazard ratio (HR) point estimates and lines indicate the 95% confidence intervals (95% CI). Diamonds depict summary hazard ratios computed under a random-effects model, with 95% confidence intervals given by their width. Unbroken vertical lines represent the null value (HR = 1.0).

