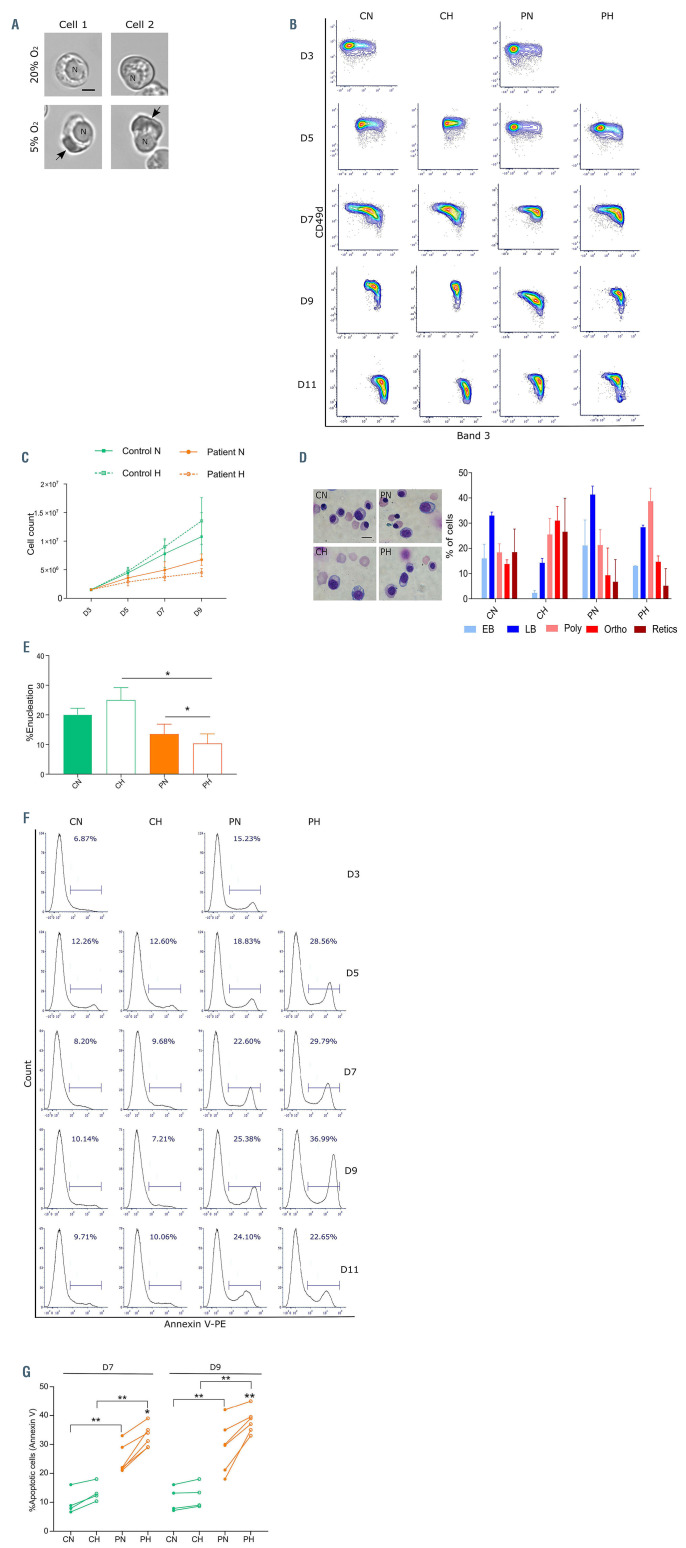
Figure 1.
Cell proliferation and apoptosis during terminal erythroid differentiation in vitro under normoxia and partial hypoxia. (A) Microscopy images of two sickle cell disease (SCD) in vitro cultured erythroblasts incubated for 30 minutes at 20% (upper panel) and 5% (lower panel) oxygen. “N” represents the nucleus and the arrow points to the HbS polymers formed under 5% oxygen; scale bar: 5 mm. (B) A contour plot representing the distribution of glycophorin A (GPA)-positive cells with respect to the expression of Band 3 (x-axis) and CD49d (y-axis) at day (D) 3, D5, D7, D9 and D11 of phase II of culture in control erythroid precursors under normoxia (CN) or hypoxia (CH), and in patient erythroid precursors under normoxia (PN) or hypoxia (PH). (C) Cell count of erythroid precursors at D3, 5, 7 and 9 in control (n=4) and patient (n=6) under normoxia (N) and hypoxia (H) (means ± standard error of the mean [SEM]). (D) May Grunwald-Giemsa staining of erythroid precursors at D9 of phase II of culture (left panel; scale bar: 10 mm) and graph representing the cellular distribution as means ± SEM of early basophilic (EB), late basophilic (LB), polychromatic (Poly), orthochromatic (Ortho) and reticulocytes (Retics) at D9 of culture of control normoxia (CN), control hypoxia (CH), patient normoxia (PN) and patient hypoxia (PH). (E) Percentage of enucleation measured at D11 for CN, CH, PN and PH erythroblasts (means ± SEM; CN and CH: n=3; PN and PH: n=6). (F) Flow cytometry plots showing percentage of apoptotic cells (Annexin V-positive cells) measured at D3, D5, D7, D9 and D11. (G) Percentage of apoptotic cells in control (n=4) and patients (n=6) under normoxia (N) and hypoxia (H) at D7 and D9 of phase II of culture. *P<0.05, **P<0.01; Wilcoxon paired test and Mann-Whitney test (E and G).

