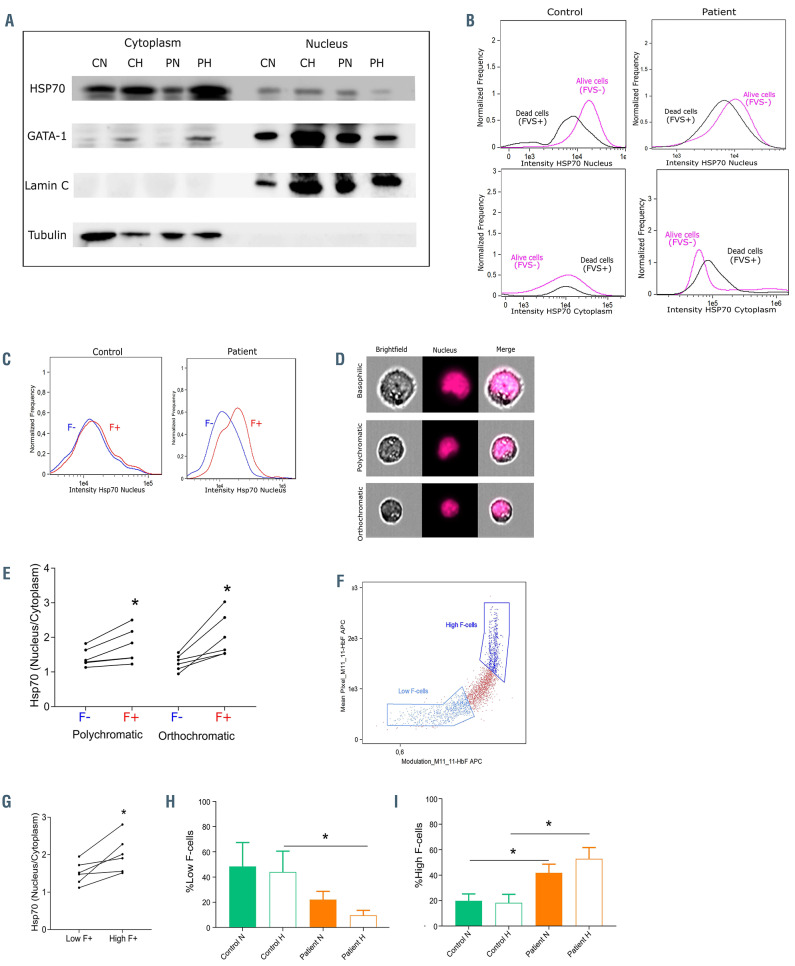
Figure 3.
HSP70 cytoplasmic and nuclear distribution. (A) Western blot analysis of HSP70, GATA-1, lamin C and tubulin performed on cytoplasmic and nuclear extracts of erythroid precursors at day 7 (D7) of phase II of culture from control normoxia (CN), control hypoxia (CH), patient normoxia (PN) and patient hypoxia (PH). (B) Distribution of the nuclear intensity (upper panel) and cytoplasmic intensity (lower panel) of HSP70 at D7 of phase II of culture in dead cells (FVS+) and live cells (FVS-) of control and patient cells under hypoxia. (C) Distribution of the nuclear intensity of HSP70 at D7 of phase II of culture in the F- and F+ subpopulations of control (left) and patient (right) cells under hypoxia. (D) Images of basophilic, polychromatic and orthochromatic subpopulations obtained by imaging flow cytometry. (E) HSP70 nucleus/cytoplasm ratio in F- and F+ polychromatic and orthochromatic patient erythroblasts at D7 of phase II of culture (n=6). (F) Dot plot representing the modulation mask of fetal hemoglobin (HbF) (x-axis) and mean pixel HbF values (y-axis) used to discriminate between low and high F-cells. (G) HSP70 nucleus/cytoplasm ratio in low and high F-cells of patients’ orthochromatic erythroblasts at D7 of phase II of culture under hypoxia (n=6). Percentage of (H) Low Fcells and (I) High F-cells in control (n=3) and patient (n=6) cells at normoxia and hypoxia at D7 of phase II of culture (means ± standard error of the mean). *P<0.05. Wilcoxon paired test (E and G) and Mann-Whitney unpaired test (H and I). FVS: fixable viability stain; F-cells: cells expressing fetal hemoglobin.

