Figure 5.
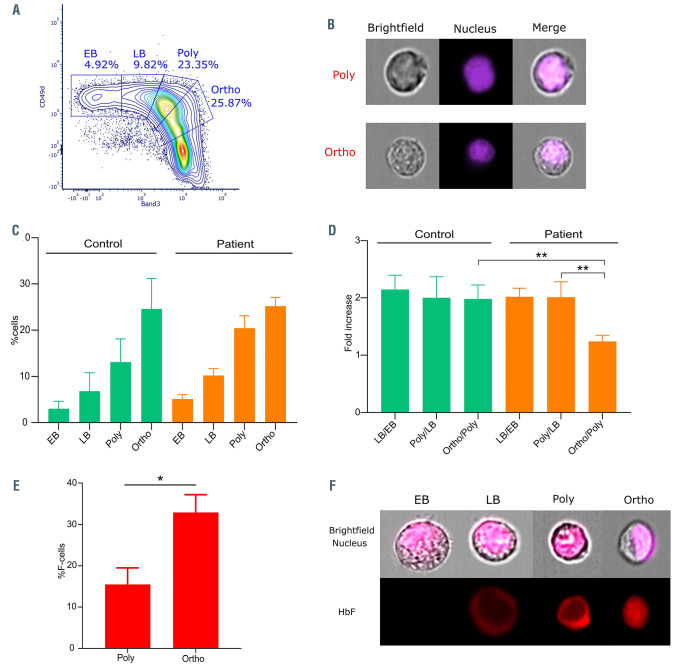
Analysis of human terminal erythroid differentiation in vivo. (A) A contour plot representing the distribution of glycophorin A (GPA)-positive cells with respect to Band 3 (x-axis) and CD49d (y-axis) from a bone marrow sample of a sickle cell disease (SCD) patient. (B) Images obtained using imaging flow cytometry from the gating of polychromatic (Poly) and orthochromatic (Ortho) erythroblasts. Nucleus was stained with Hoechst. (C) Percentage of cells at the early basophilic (EB), late basophilic (LB), polychromatic (Poly) and orthochromatic (Ortho) stages in five bone marrow samples of controls (green) and SCD patients (orange) (means ± standard error of the mean [SEM]). (D) The fold increase of cells between the EB and LB (LB/EB), LB and Poly (Poly/LB), Poly and Ortho (Ortho/Poly) stages in five controls and five SCD patients (means ± SEM). (E) Percentage of cells expressing fetal hemoglobin (F-cells) in vivo in the polychromatic (Poly) and orthochromatic (Ortho) subpopulations of the patient bone marrow samples (n=5) (means ± SEM). (F) Imaging flow cytometry images of early basophilic (EB), late basophilic (LB), polychromatic (Poly) and orthochromatic (Ortho) precursors. Upper images are a merge of brightfield and nucleus, lower images are for fetal hemoglobin (HbF) staining (red). *P<0.05, **P<0.01; Mann-Whitney test (D and E).

