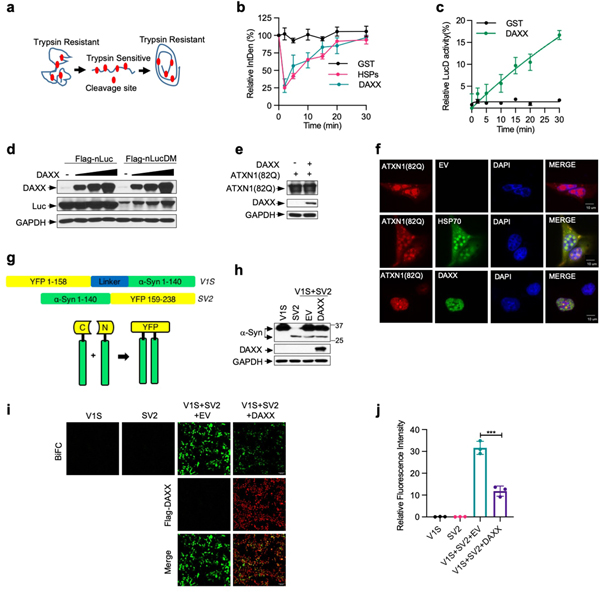
Extended Data Fig. 4 |. DAXX unfolds misfolded LucD and protects against protein aggregation and oligomerization in cells.
a, A schematic representation of compact misfolded LucD monomers, the unfolded intermediates, and the native conformers, as well as their sensitivity to brief trypsin digestion. b, DAXX changes trypsin sensitivity of LucD. LucD (50 nM) was incubated with DAXX-–xHis (100 nM), GST (100 nM), or HSPs (100 nM HSP70, 50 nM HSP40 and 200 nM HSP104(A503S)) at 25 °C. At indicated time points, aliquots of luciferase were incubated with 2.5 μM trypsin at 22 °C for 2 min and were analysed by western blot. Shown is luciferase band intensity. A representative western blot is presented in Fig. 2g. c, DAXX increases the enzymatic activity of LucD. Misfolded LucD monomers (50 nM) were incubated with GST (100 nM) or DAXX–6xHis (100 nM) for indicated durations and assayed for luciferase activity. d, DAXX elevates the levels of nLucDM, but not nLuc, in cells. nLuc or nLucDM was transfected together with empty vector (EV) or Flag–DAXX in HEK293T cells. Cell lysates were analysed by western blot 24 h after transfection. e, f, DAXX reduces aggregation, but not expression, of ATXN1(82Q) in cells. U2OS cells transfected with HA-Atxn1–82Q together with EV, Flag–DAXX (e, f) or GFP–HSP70 (f) were analysed by western blot (e), or immunofluorescence with anti-HA (red) and anti-Flag (green) antibodies (f; scale bar, 10 μm). Quantification of the percentage of cells containing different sizes Atxn1–82Q inclusions is shown in Fig. 2i. g, Schematic representation of BiFC assay based on Venus, an improved version of yellow fluorescent protein (YFP). h–j, DAXX inhibits α-Syn oligomerization in cells. HEK293T cells were transfected with V1S and SV2 individually, or together with empty vector (EV) or DAXX. Cells were analysed by western blot for protein expression (h) and by fluorescence microscopy for BiFC signals and Flag–DAXX expression (i; scale bars, 100 μm), with the quantification of BiFC signals shown in j. Assay in d, e, f, h and i have been performed two times with similar results. Numerical data are mean ± s.d. (n = 3) and are representative of three independent experiments (b, c, j). *P < 0.05, **P < 0.01, ***P < 0.001; unpaired Student’s t-test.

