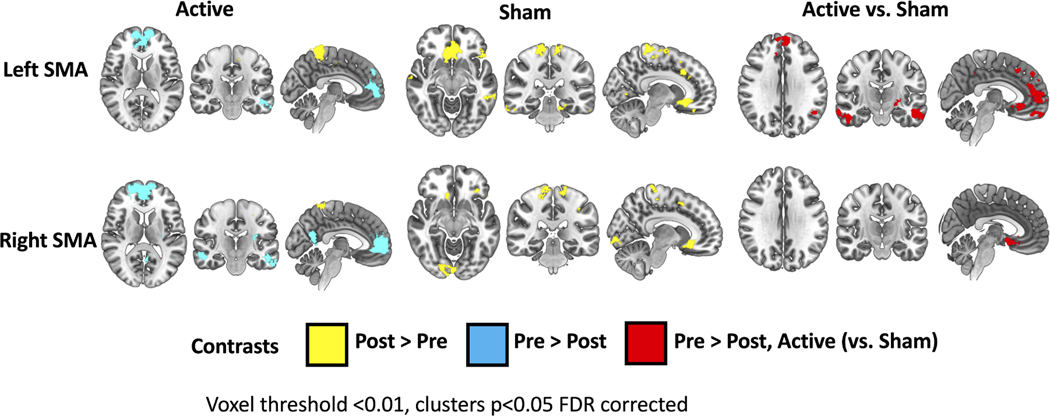
Figure 2. SMA resting-state functional connectivity changes following active vs sham rTMS and gait training.
Brain regions with either increased (yellow) or decreased (blue) SMA connectivity following the intervention are shown on an MNI template. Brain regions are shown where active stimulation (relative to sham) had a greater SMA connectivity decrease (red). Clusters p<0.05, FDR corrected.

