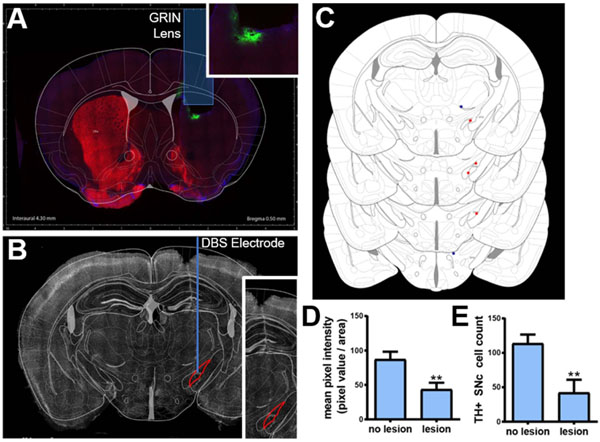
Figure 3. Histological and behavioral assessments.
(A) Coronal view of the histological analysis through the striatum showing lens placement, GCaMP6m expression (green label, inset), tyrosine hydroxylase (TH) stain (red label) demonstrating unilateral dopaminergic lesion in the striatum a healthy animal (B) Coronal view indicating DBS electrode placement in the subthalamic nucleus (STN). (C) A coronal atlas view showing DBS lead placement in six animals (orange dots indicate electrodes located within the STN, blue dots indicate electrodes placed outside of the STN) compared to the location of the STN. (D) TH + mean pixel intensity (0–255) calculated over dorsal striatum, (Welch’s unequal variance t-test, p < .05, n = 10) and (E) quantification of TH positive SNc cells in lesioned and non-lesioned hemispheres (Welch’s unequal variance t-test p < .05, n = 12; 1866 total cells), indicating successful 6-OHDA lesioning.

