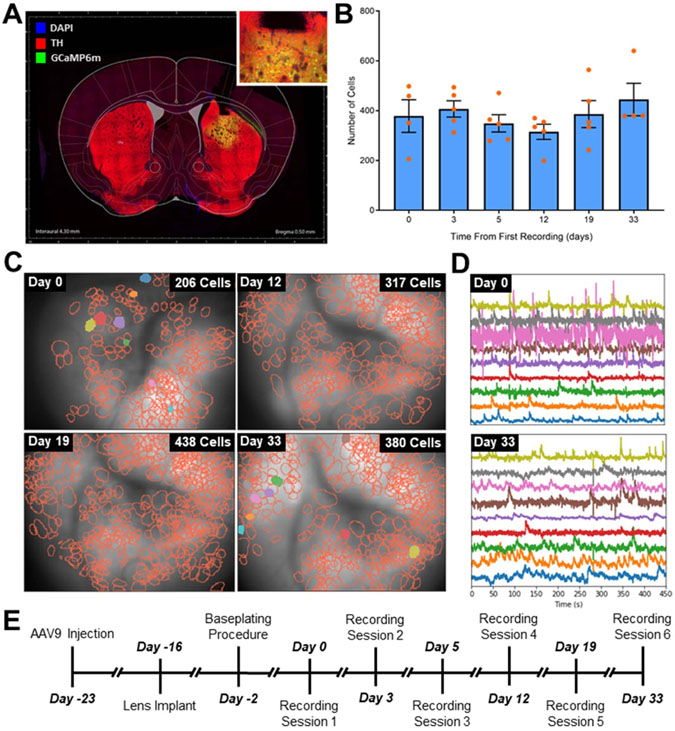
Figure 4. Chronic calcium recordings in healthy mice.
(A) A coronal view through the striatum of a healthy mouse indicating lens placement, GCaMP6m expression (green, inset), but no dopaminergic lesion as shown by the TH + stain (red) for dopaminergic cells. (B) The number of cells recorded across a cohort of five mice and identified using constrained non-negative matrix factorization for microendoscope data (CNMF-E) was consistent over 33 d (p = 0.89; one-way ANOVA). (C) Representative mouse showing that the number of striatal neurons identified by CNMF-E over the course of the study (note the rotation of the microscope field of view between days 0 and 12). (D) Randomly selected calcium traces from ten cells extracted by CNMF-E. (E) Experimental timeline for these experiments.

