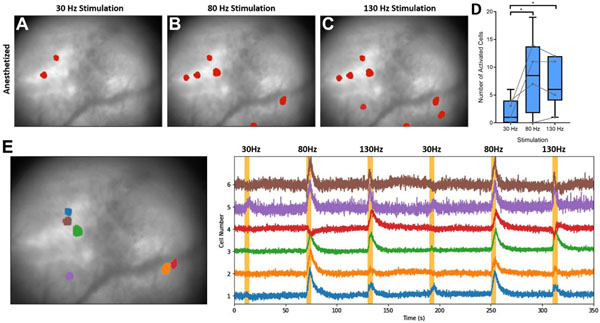
Figure 6. Frequency dependent responses to electrical stimulation of the subthalamic nucleus (STN).
(A)–(C) Cells responding to 30, 80, and 130 Hz stimulation from three consecutive stimuli, respectively, overlaid on the mean background image recorded in a representative anesthetized mouse. (D) Number of activated cells responding to 30–130 Hz stimulation in a cohort of four mice with three repetitions of each stimulation. Kruskal–Wallis one-way ANOVA, Dunn’s multiple comparison test; * indicates p < 0.05. Gray dots show the median within-animal responses for each animal. Analysis was performed on 19, 4, 7, and 14 total neurons identified during stimulation under anesthesia. (E) Heterogeneity of neuronal responses to 30, 80, and 130 Hz stimuli in one representative 6-OHDA lesioned mouse.

