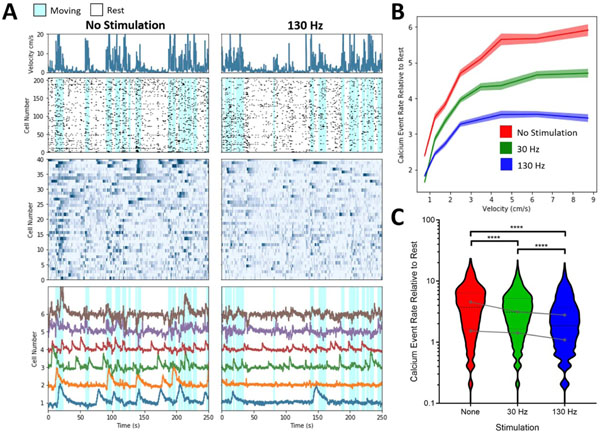
Figure 7. Relationship between neural activity and animal behavior (velocity) change with STN stimulation.
(A) Striatal cell activity (lower panels) identified by constrained non-negative matrix factorization for microendoscope data (CNMF-E) was correlated with mouse behavior (top row), as measured by velocity, across stimulated and unstimulated open field behavior sessions. The second row displays the identified calcium events from all cells in a representative data set, while the third row represents calcium traces from 40 cells with the highest SNR in the same data set. The fourth row shows cell traces for the neurons with identified calcium events that are most correlated with mouse velocity during periods of no stimulation, showing examples increased activity during periods of movement. (B) Differences in the relationship between the rate of calcium events normalized to no stimulation at rest (velocity < 0.5 cm s−1) between all stimulation paradigms. (C) The rate of calcium events normalized to no stimulation at rest (velocity < 0.5 cm s −1) between all stimulation paradigms. Kruskal–Wallis one-way analysis of variance, Dunn’s multiple comparison test; **** indicates p < 0.0001. Gray dots show median within animal responses to stimulation. Analysis was performed on 208 and 344 neurons identified in these two animals.

