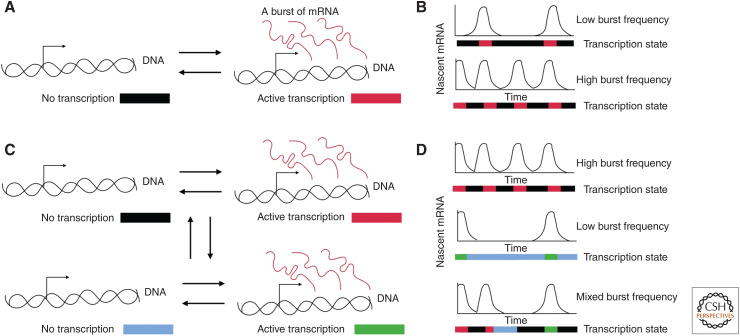
Figure 1.
Transcription varies in time. (A) The two-state model for transcription in which a gene can switch between an inactive state and active state leading to bursts of RNA. (B) Illustration of a gene with a low burst frequency and a high burst frequency. The colors underneath each time trace indicate the underlying state of the gene through time. (C) A multistate model of transcription in which a gene can switch between states with different burst frequencies. The gene can occupy one of four different states illustrated with the different colors. (D) The diverse time traces produced by a multistate model of transcription dynamics. The colors underneath the time traces show the actual state of the gene.

