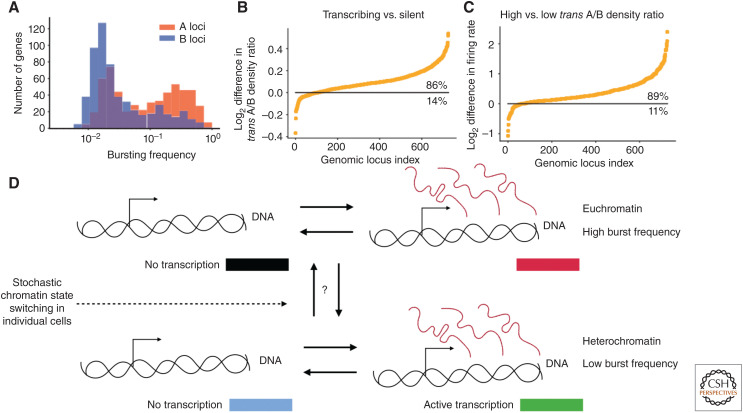
Figure 4.
Relationship between transcriptional bursting and compartmentalization. (A) The bimodal bursting frequency distribution of genes naturally found in the ensemble-A and -B chromatin states. (B) The difference in the trans A/B ratio (the local density of trans-ensemble-A loci to trans-ensemble-B loci in individual cells around each gene) when a gene was transcribing versus when it was not, showing there is a strong correlation between chromatin state and transcription state in individual cells. (C) Similar to B but with the difference in bursting rate on the y-axis between high and low trans A/B density, showing a strong correlation of chromatin state in individual cells and burst frequency. (Figures and data in A–C from Su et al. 2020; reprinted, with permission, from Elsevier © 2020.) (D) Hypothetical model of transcription for a gene with two different burst frequencies owing to variations in chromatin state within individual cells (the same as Fig. 1A).

