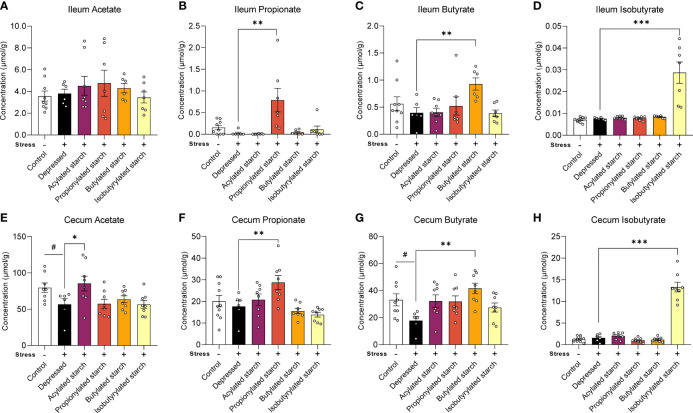
Figure 2.
The SCFAs levels in the ileum and cecum. (A–D) Acetate, propitiate, butyrate, and isobutyrate levels in the ileum. (E–H) Acetate, propitiate, butyrate, and isobutyrate levels in the cecum. Except for the control, all groups are given two-week chronic restraint stress. Data are mean with SEM (n=6-10 per group for each test). # P<0.05 in the unpaired t-tests. *P<0.05, **P<0.01, ***P<0.001 in the unpaired t-tests.

