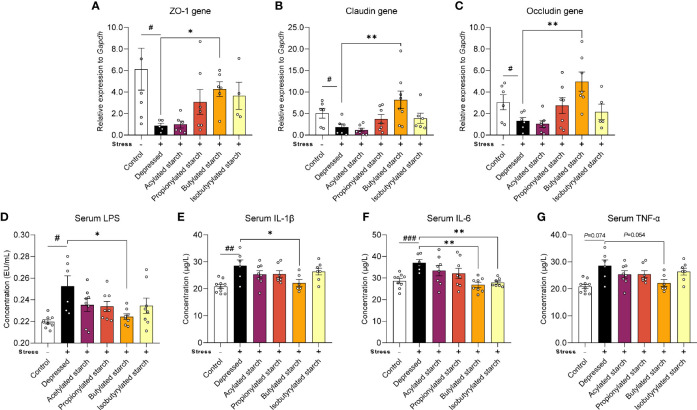
Figure 3.
The SCFAs levels in the ileum and cecum. (A–C) mRNA levels of the ZO-1, Claudin, and Occludin protein in the colon tissues. (D–G) Serum LPS and inflammatory cytokines (IL-1β, IL-6, and TNF-α) levels. Except for the control, all groups are given two-week chronic restraint stress. Data are mean with SEM (n=6-10 per group for each test). # P<0.05, ## P<0.01, ### P<0.001 in the unpaired t-tests. *P<0.05, **P<0.01 in the unpaired t-tests.

