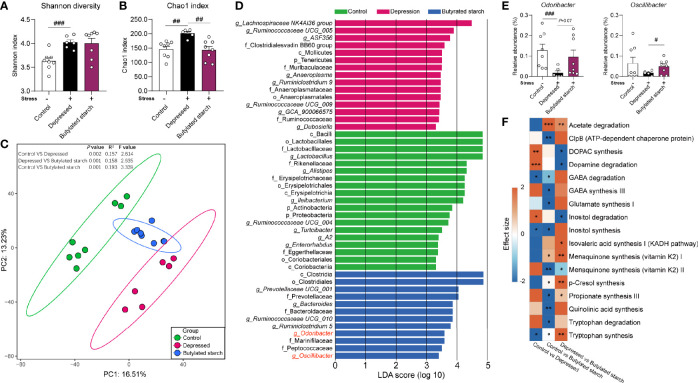
Figure 4.
The SCFAs levels in the ileum and cecum. (A, B) Alpha diversity of the gut microbiome, quantified using the Shannon and Chao 1 index. Except for the control, all groups are given two-week chronic restraint stress. Data are mean with SEM (n=6-10 per group). ## P<0.01, ### P<0.001 in the unpaired t-tests. (C) Beta diversity of the gut microbiome. PCA based on the center-log ratio transferred Aitchison distance followed by the PERMANOVA. (D) Microbial biomarkers are identified by the linear discriminant analysis (LDA) effect size algorithm (LEfSe). α<0.05 in the Wilcoxon rank-sum test and log LDA>2.0 were used as the threshold. (E) Relative abundance of selected microbes. Data are mean with SEM (n=6-10 per group). # P<0.05, ### P<0.001 in the unpaired t-tests. (F) Gut-brain module analysis. The colors of the boxes indicate the effect size between the two groups. Welch’s t-test was performed between two groups. Asterisks in the heat map represent the Benjamini-Hochberg false discovery rate (FDR)-adjusted p-value: *P<0.05, **P<0.01, ***P<0.001.

