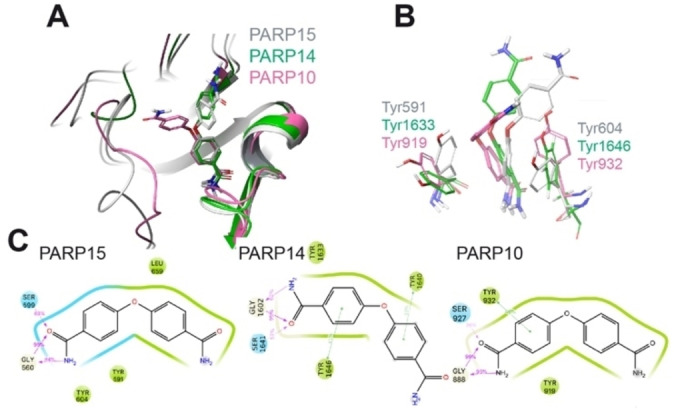
Figure 4.

Modeling of the interaction of compound 1 with mono‐ADP‐ribosyltransferases. A) Structural comparison of the modeled PARP10 and PARP14 in complex with compound 1 with the deposited crystal structure of 1‐PARP15‐Y598L complex (PDB id. 6EK3). PARP10, 14 and 15 are in pink, green, and grey cartoon representation, respectively. 1 is in stick representation with the same color code as used for the proteins. Non‐polar hydrogens are not displayed. B) Details of the relative position of OUL35 are shown with respect to the Tyr residues in PARP10, PARP14 and PARP15‐Y598L. The color‐code is the same as used in panel A. C) 2D interaction scheme of OUL35 with PARP10, PARP14 and PARP15‐Y598L, respectively. The percentage of occurrence of the main interactions during the overall MD trajectories is also indicated. Green and cyan spheres indicate hydrophobic and polar residues, respectively. While grey and white spheres are for glycine and water, respectively. Green lines indicate pi‐stacking interactions, while pink arrows indicate the presence of hydrogen bonds.
