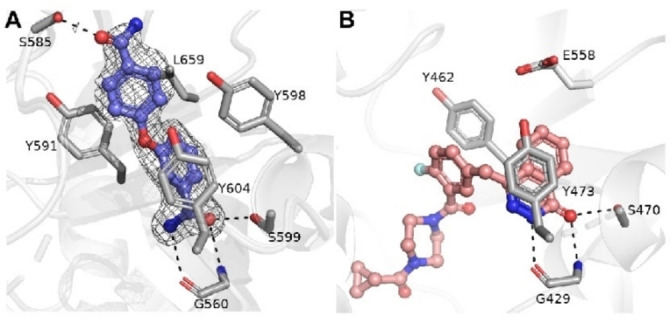
Figure 6.

Structural comparison of PARP15 – compound 20 and PARP2 – Olaparib complexes. A) Crystal structure of PARP15 in complex with compound 20. Sigma A weighted omit Fo−Fc electron density map is colored in light grey and contoured at 2.5 σ. Amino acid residues and compound 20 are colored in purple and magenta, respectively. Hydrogen bonds between 20 and residues are indicated by black dash lines. B) The crystal structure of PARP2 in complex with Olaparib (PDB accession code 4TVJ). The residues and compound are colored in white and magenta, respectively.
